Model the color, size, and shape of real galaxies (ELG, star forming) sampled by DESI and eBOSS Target Selection
In [1]:
import numpy as np
import os
import pandas as pd
import seaborn as sns
import fitsio
import sys
sys.path.append('/Users/kaylan1/PhdStudent/Research/desi/astrometry.net/astrometry')
from astrometry.util.fits import fits_table, merge_tables
from glob import glob

from sklearn import mixture

# to make this notebook's output stable across runs
np.random.seed(7)

# To plot pretty figures
%matplotlib inline
import matplotlib
import matplotlib.pyplot as plt
plt.rcParams['axes.labelsize'] = 14
plt.rcParams['xtick.labelsize'] = 12
plt.rcParams['ytick.labelsize'] = 12

%load_ext autoreload
%autoreload 2
In [4]:
from obiwan.common import fits2pandas
In [5]:
def stack_tables(fns):
    cat=[]
    assert(len(fns) > 0)
    for fn in fns:
        assert(os.path.exists(fn))
        print('Stacking %s' % fn)
        cat.append( fits_table(fn) )
    return merge_tables(cat, columns='fillzero')

def flux2mag(nmgy):
    return -2.5 * (np.log10(nmgy) - 9)
In [405]:
def my_mixture(X,n_comp=None,cov_type='full'):
    # Compute density via Gaussian Mixtures
    # we'll try several numbers of clusters
    if n_comp is None:
        n_comp = np.arange(1, 16)
    gmms = [mixture.GaussianMixture(n_components=n,
                                    covariance_type= cov_type).fit(X)
            for n in n_comp]
    BICs = [gmm.bic(X)/X.shape[0] for gmm in gmms]
    i_min = np.argmin(BICs)
    print("%d components" % n_comp[i_min])
    return gmms,i_min, n_comp, BICs
In [452]:
class GaussianMixtureModel(object):
    """
    John's class to read, write, and sample from a mixture model.

    Args:
        weights,means,covars: array-like, from mixture fit
        covar_type: usually 'full'
        py: one of ['27','36']
    """
    def __init__(self, weights, means, covars,
                 py=None,covar_type='full',is1D=False):
        assert(py in ['27','36'])
        self.py= py
        self.is1D= is1D
        self.weights_ = weights
        self.means_ = means
        self.covariances_ = covars
        if self.is1D:
            self.weights_ = self.weights_.reshape(-1,1)
            self.means_ = self.means_.reshape(-1,1)
            self.covariances_ = self.covariances_.reshape(-1,1,1)
        #    self.n_components, self.n_dimensions = self.means_.shape[0],1
        #else:
        self.n_components, self.n_dimensions = self.means_.shape
        #print(self.weights_.shape,self.covariances_.shape,len(self.covariances_.shape))
        self.covariance_type= covar_type

    @staticmethod
    def save(model, filename):
        for name,data in zip(['means','weights','covars'],
                     [model.means_, model.weights_,
                      model.covariances_]):
            fn= '%s_%s.txt' % (filename,name)
            np.savetxt(fn,data,delimiter=',')
            print('Wrote %s' % fn)

    @staticmethod
    def load(filename,py=None,is1D=False):
        d={name:np.loadtxt('%s_%s.txt' % (filename,name),delimiter=',')
           for name in ['means','weights','covars']}
        return GaussianMixtureModel(
                    d['weights'],d['means'],d['covars'],
                    covar_type='full',py=py,is1D=is1D)

    def sample(self, n_samples=1, random_state=None):
        assert(n_samples >= 1)
        self.n_samples= n_samples
        if random_state is None:
            random_state = np.random.RandomState()
        self.rng= random_state

        if self.py == '2.7':
            X= self.sample_py2()
        else:
            X,Y= self.sample_py3()
        return X

    def sample_py2(self):
        weight_cdf = np.cumsum(self.weights_)
        X = np.empty((self.n_samples, self.n_components))
        rand = self.rng.rand(self.n_samples)
        # decide which component to use for each sample
        comps = weight_cdf.searchsorted(rand)
        # for each component, generate all needed samples
        for comp in range(self.n_components):
            # occurrences of current component in X
            comp_in_X = (comp == comps)
            # number of those occurrences
            num_comp_in_X = comp_in_X.sum()
            if num_comp_in_X > 0:
                X[comp_in_X] = self.rng.multivariate_normal(
                    self.means_[comp], self.covariances_[comp], num_comp_in_X)
        return X

    def sample_py3(self):
        """Copied from sklearn's mixture.GaussianMixture().sample()"""
        print(self.weights_.shape)
        try:
            n_samples_comp = self.rng.multinomial(self.n_samples, self.weights_)
        except ValueError:
            self.weights_= np.reshape(self.weights_,len(self.weights_))
            n_samples_comp = self.rng.multinomial(self.n_samples, self.weights_)
        if self.covariance_type == 'full':
            X = np.vstack([
                self.rng.multivariate_normal(mean, covariance, int(sample))
                for (mean, covariance, sample) in zip(
                    self.means_, self.covariances_, n_samples_comp)])
        elif self.covariance_type == "tied":
            X = np.vstack([
                self.rng.multivariate_normal(mean, self.covariances_, int(sample))
                for (mean, sample) in zip(
                    self.means_, n_samples_comp)])
        else:
            X = np.vstack([
                mean + self.rng.randn(sample, n_features) * np.sqrt(covariance)
                for (mean, covariance, sample) in zip(
                    self.means_, self.covariances_, n_samples_comp)])

        y = np.concatenate([j * np.ones(sample, dtype=int)
                           for j, sample in enumerate(n_samples_comp)])

        return (X, y)
eBOSS
Exploratory Data analysis
In [781]:
fns_ngc= [os.path.join(os.environ['HOME'],'Downloads',
            'ebossDR3','redshift_tractorcats','eBOSS.ELG.obiwan.eboss%s.fits' % name)
          for name in ['23.v5_10_7']]
fns_sgc= [os.path.join(os.environ['HOME'],'Downloads',
            'ebossDR3','redshift_tractorcats','eBOSS.ELG.obiwan.eboss%s.fits' % name)
         for name in ['2122.v5_10_7']]

ngc=merge_tables([fits_table(fn)
                 for fn in fns_ngc],columns='fillzero')
ngc.set('field',np.array(['ngc']*len(ngc),dtype=object))
sgc=merge_tables([fits_table(fn)
                 for fn in fns_sgc],columns='fillzero')
sgc.set('field',np.array(['sgc']*len(sgc),dtype=object))

print(len(ngc),len(ngc.get_columns()))
print(len(sgc),len(sgc.get_columns()))
for col in sgc.get_columns():
    if not 'decam' in col:
        continue
    print(col,ngc.get(col).shape,sgc.get(col).shape)
Converted brickname from |S8 to <U8
Converted type from |S4 to <U4
Converted chunk from |S7 to <U7
Converted datadir from |S150 to <U150
Converted brickname from |S8 to <U8
Converted type from |S4 to <U4
Converted chunk from |S7 to <U7
Converted datadir from |S150 to <U150
48397 51
108060 57
decam_flux (48397, 6) (108060, 6)
decam_flux_ivar (48397, 6) (108060, 6)
decam_apflux (48397, 48) (108060, 6, 8)
decam_apflux_resid (48397, 48) (108060, 6, 8)
decam_apflux_ivar (48397, 48) (108060, 6, 8)
decam_mw_transmission (48397, 6) (108060, 6)
decam_nobs (48397, 6) (108060, 6)
decam_rchi2 (48397, 6) (108060, 6)
decam_fracflux (48397, 6) (108060, 6)
decam_fracmasked (48397, 6) (108060, 6)
decam_fracin (48397, 6) (108060, 6)
decam_anymask (48397, 6) (108060, 6)
decam_allmask (48397, 6) (108060, 6)
decam_psfsize (48397, 6) (108060, 6)
In [782]:
for col in set(sgc.get_columns()).intersection(set(ngc.get_columns())):
    if 'apflux' in col:
        print('Removing col: ',col)
        sgc.delete_column(col)
        ngc.delete_column(col)
a= merge_tables([ngc,sgc],columns='fillzero')
Removing col:  decam_apflux
Removing col:  decam_apflux_resid
Removing col:  decam_apflux_ivar
In [783]:
isStar= a.z_flag == -1
hasRedshift= a.z_flag == 1
isPrim= a.brick_primary == True
print('isStar & brick primary: %d/%d' % \
     (len(a[(isStar) & (isPrim)]),len(a)))
print('hasRedshift & brick primary: %d/%d' % \
     (len(a[(hasRedshift) & (isPrim)]),len(a)))
a.cut((hasRedshift) & (isPrim))
isStar & brick primary: 924/156457
hasRedshift & brick primary: 124818/156457
In [776]:
for key in ['sector_tsr','chunk',
            'plate','fiberid']:
    print(key,a.get(key)[0],type(a.get(key)[0]))
sector_tsr 0.54 <class 'numpy.float32'>
chunk eboss23 <class 'numpy.str_'>
plate 9564 <class 'numpy.int32'>
fiberid 504 <class 'numpy.int32'>
In [794]:
d={}
for i,b in zip([1,2,4],'grz'):
    d[b+'flux']= a.get('decam_flux')[:,i]
    d[b+'fluxivar']= a.get('decam_flux_ivar')[:,i]
    d[b+'psfsize']= a.get('decam_psfsize')[:,i]
    d[b+'_mw_transmission']= a.get('decam_mw_transmission')[:,i]
d['type']= a.type
d['shapeexp_r']= a.shapeexp_r
d['shapedev_r']= a.shapedev_r

d['redshift']= a.z
d['sector_tsr']= a.sector_tsr
d['field']= a.field

eboss= pd.DataFrame(d)
eboss= eboss.apply(lambda x: x.values.byteswap().newbyteorder())


for i,b in zip([1,2,4],'grz'):
    eboss[b]= flux2mag(eboss[b+'flux'].values/eboss[b+'_mw_transmission'].values)
eboss['g-r']= eboss['g'] - eboss['r']
eboss['r-z']= eboss['r'] - eboss['z']

# SDSS unique identifier is (PLATE,MJD,FIBERID)
for key in ['plate','mjd','fiberid']:
    assert(not key in eboss.columns)
    eboss[key]= a.get(key)


eboss.describe()
Out[794]:
| g_mw_transmission | gflux | gfluxivar | gpsfsize | r_mw_transmission | redshift | rflux | rfluxivar | rpsfsize | sector_tsr | ... | zfluxivar | zpsfsize | g | r | z | g-r | r-z | plate | mjd | fiberid | |
|---|---|---|---|---|---|---|---|---|---|---|---|---|---|---|---|---|---|---|---|---|---|
| count | 124818.000000 | 124818.000000 | 124818.000000 | 124818.000000 | 124818.000000 | 124818.000000 | 124818.000000 | 124818.000000 | 124818.000000 | 124818.000000 | ... | 124818.000000 | 124818.000000 | 124818.000000 | 124818.000000 | 124818.000000 | 124818.000000 | 124818.000000 | 124818.000000 | 124818.000000 | 124818.000000 |
| mean | 0.887981 | 0.894358 | 663.596191 | 1.585073 | 0.922737 | 0.845346 | 1.695404 | 404.526794 | 1.262581 | 0.925419 | ... | 41.047676 | 1.154662 | 22.523006 | 21.882172 | 20.909605 | 0.640837 | 0.972565 | 9394.769817 | 57891.387572 | 498.775401 |
| std | 0.051016 | 0.233051 | 586.811768 | 0.182776 | 0.036416 | 0.220672 | 0.508343 | 534.675598 | 0.186244 | 0.116810 | ... | 35.968708 | 0.145182 | 0.253308 | 0.299463 | 0.361003 | 0.138784 | 0.179721 | 139.772085 | 152.686943 | 287.418148 |
| min | 0.541891 | 0.423581 | 0.000285 | 0.000000 | 0.661849 | 0.000010 | 0.813217 | 0.016720 | 0.000000 | 0.094000 | ... | 0.000004 | 0.000000 | 21.825092 | 20.921309 | 19.572298 | 0.345093 | 0.661255 | 9197.000000 | 57656.000000 | 1.000000 |
| 25% | 0.870798 | 0.719299 | 258.765213 | 1.463014 | 0.911019 | 0.764202 | 1.324715 | 116.953539 | 1.139694 | 0.887000 | ... | 15.754657 | 1.049614 | 22.363008 | 21.690143 | 20.667189 | 0.523310 | 0.828516 | 9309.000000 | 57728.000000 | 247.000000 |
| 50% | 0.904013 | 0.825104 | 546.302612 | 1.590574 | 0.934283 | 0.831748 | 1.570839 | 260.817749 | 1.223145 | 0.985000 | ... | 31.407959 | 1.124252 | 22.580585 | 21.921579 | 20.939089 | 0.639626 | 0.944961 | 9374.000000 | 57864.000000 | 500.000000 |
| 75% | 0.921569 | 1.008793 | 895.015701 | 1.703754 | 0.946467 | 0.920407 | 1.945317 | 469.033813 | 1.336910 | 0.994000 | ... | 54.780305 | 1.229884 | 22.729773 | 22.106296 | 21.178267 | 0.758045 | 1.090259 | 9556.000000 | 58055.000000 | 748.000000 |
| max | 0.961263 | 1.770160 | 11717.317383 | 4.630108 | 0.973738 | 6.737325 | 4.008598 | 7636.661621 | 4.266237 | 1.000000 | ... | 569.374512 | 2.403814 | 22.899969 | 22.529026 | 21.801359 | 0.927851 | 1.704117 | 9630.000000 | 58086.000000 | 1000.000000 |
8 rows × 24 columns
In [795]:
print(eboss['type'].value_counts())
# Remove COMP
isCOMP= eboss['type'].str.strip().values == 'COMP'
eboss= eboss[~isCOMP]
print(eboss['type'].value_counts())
print(eboss['type'].value_counts()/eboss.shape[0])
EXP     73791
SIMP    34960
DEV     10442
PSF      3641
COMP     1984
Name: type, dtype: int64
EXP     73791
SIMP    34960
DEV     10442
PSF      3641
Name: type, dtype: int64
EXP     0.600738
SIMP    0.284612
DEV     0.085009
PSF     0.029642
Name: type, dtype: float64
In [796]:
grz_gt0= ((eboss['gflux'] > 0) &
          (eboss['rflux'] > 0) &
          (eboss['zflux'] > 0) &
          (eboss['gfluxivar'] > 0) &
          (eboss['rfluxivar'] > 0) &
          (eboss['zfluxivar'] > 0))
assert(eboss[grz_gt0].shape[0] == eboss.shape[0])

print(set(eboss['type']))
fwhm_or_rhalf= np.zeros(eboss.shape[0])-1 # arcsec
strip_type= eboss['type'].str.strip().values
isPSF= strip_type == 'PSF'
isEXP= pd.Series(strip_type).isin(['EXP','REX']).values
isSIMP= strip_type == 'SIMP'
isDEV= strip_type == 'DEV'
# rhalf ~ fwhm/2
fwhm_or_rhalf[isPSF]= np.mean(np.array([eboss.loc[isPSF,'gpsfsize'],
                                        eboss.loc[isPSF,'rpsfsize'],
                                        eboss.loc[isPSF,'zpsfsize']]),axis=0)/2
fwhm_or_rhalf[isSIMP]= 0.5
fwhm_or_rhalf[isEXP]= eboss.loc[isEXP,'shapeexp_r']
fwhm_or_rhalf[isDEV]= eboss.loc[isDEV,'shapedev_r']
eboss['fwhm_or_rhalf']= fwhm_or_rhalf
{'DEV ', 'SIMP', 'EXP ', 'PSF '}
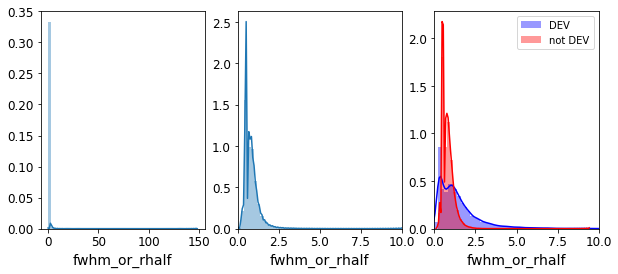
DEV are larger than EXP
In [797]:
fig,ax= plt.subplots(1,3,figsize=(10,4))
sns.distplot(eboss['fwhm_or_rhalf'],ax=ax[0])
isSmall= (eboss['fwhm_or_rhalf'] < 10).values
sns.distplot(eboss.loc[isSmall,'fwhm_or_rhalf'],ax=ax[1])
ax[1].set_xlim(0,10)

sns.distplot(eboss.loc[(isSmall) & (isDEV),'fwhm_or_rhalf'],color='b',ax=ax[2],
             label='DEV')
sns.distplot(eboss.loc[(isSmall) & (~isDEV),'fwhm_or_rhalf'],color='r',ax=ax[2],
             label='not DEV')
ax[2].set_xlim(0,10)
ax[2].legend()
Out[797]:
<matplotlib.legend.Legend at 0x138337b38>
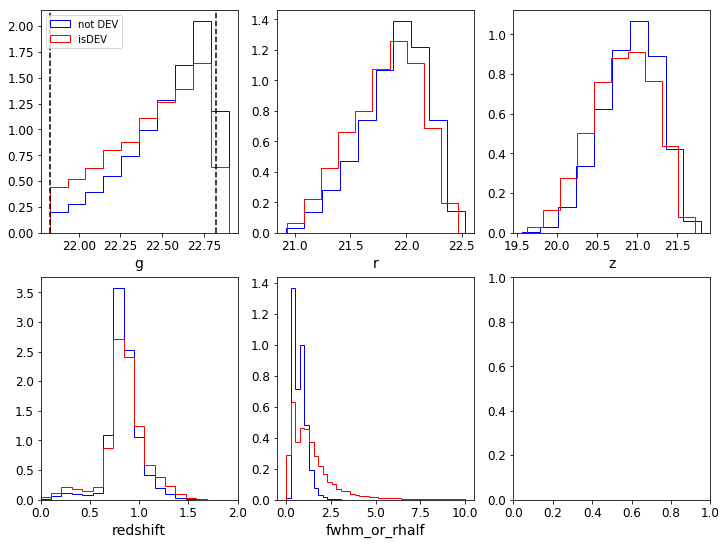
DEV are brighter than EXP
In [798]:
attrs= ['g','r','z','redshift','fwhm_or_rhalf']
fig,ax= plt.subplots(2,3,figsize=(12,9))
i=-1
for row in range(2):
    for col in range(3):
        i+=1
        if i >= len(attrs):
            continue
        bins=None
        if attrs[i] == 'redshift':
            bins=np.linspace(0,2,20)
        if attrs[i] == 'fwhm_or_rhalf':
            bins=np.linspace(0,10,40)
        _=ax[row,col].hist(eboss.loc[(~isDEV) & (isSmall),attrs[i]],histtype='step',normed=True,
                           color='b',bins=bins,label='not DEV')
        _=ax[row,col].hist(eboss.loc[(isDEV) & (isSmall),attrs[i]],histtype='step',normed=True,
                           color='r',bins=bins,label='isDEV')
        ax[row,col].set_xlabel(attrs[i])
        if i == 0:
            ax[row,col].legend(loc='upper left')
ax[1,0].set_xlim(0,2)

#gband
oii_emitters= [21.825, 22.825]
#ax[0,0].set_xlim(oii_emitters)
ax[0,0].axvline(oii_emitters[0],c='k',ls='--')
ax[0,0].axvline(oii_emitters[1],c='k',ls='--')

print('fraction NOT dev: ',eboss[~isDEV].shape[0]/eboss.shape[0])
print('fraction dev: ',eboss[isDEV].shape[0]/eboss.shape[0])
fraction NOT dev:  0.9149909634140384
fraction dev:  0.08500903658596154
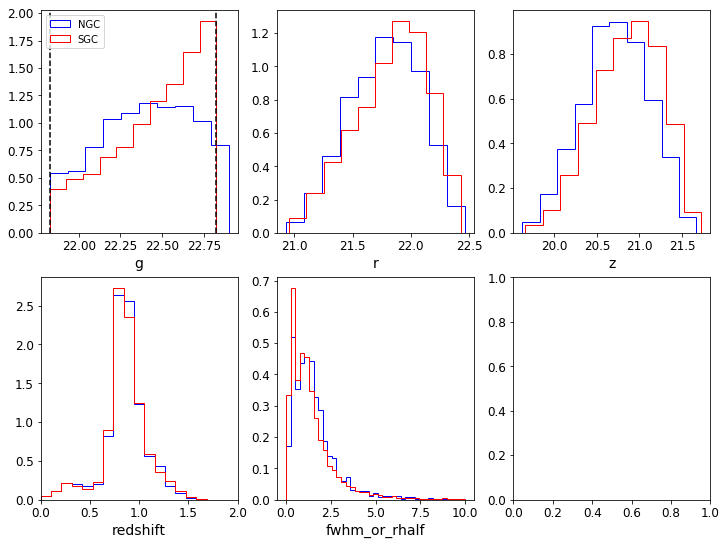
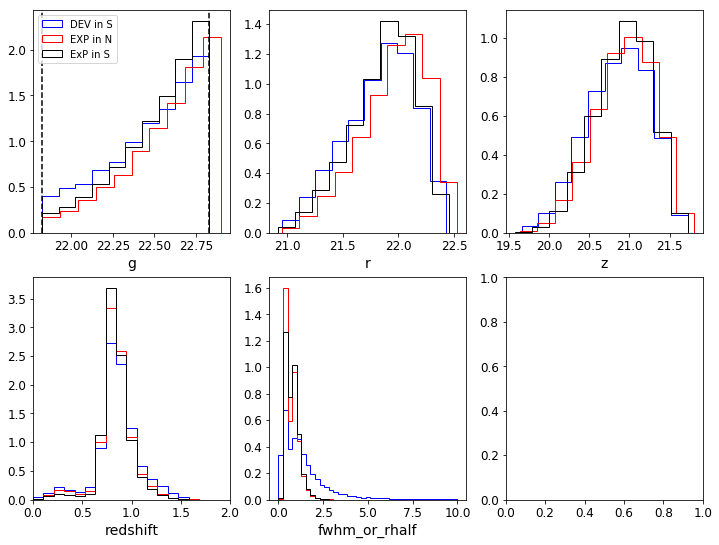
NGC is incomplete
In [799]:
isNGC= eboss['field'] == 'ngc'

attrs= ['g','r','z','redshift','fwhm_or_rhalf']
fig,ax= plt.subplots(2,3,figsize=(12,9))
i=-1
for row in range(2):
    for col in range(3):
        i+=1
        if i >= len(attrs):
            continue
        bins=None
        if attrs[i] == 'redshift':
            bins=np.linspace(0,2,20)
        if attrs[i] == 'fwhm_or_rhalf':
            bins=np.linspace(0,10,40)
        _=ax[row,col].hist(eboss.loc[(isNGC) & (isDEV) & (isSmall),attrs[i]],histtype='step',normed=True,
                           color='b',bins=bins,label='NGC')
        _=ax[row,col].hist(eboss.loc[(~isNGC) & (isDEV) & (isSmall),attrs[i]],histtype='step',normed=True,
                           color='r',bins=bins,label='SGC')
        ax[row,col].set_xlabel(attrs[i])
        if i == 0:
            ax[row,col].legend(loc='upper left')
ax[1,0].set_xlim(0,2)

#gband
oii_emitters= [21.825, 22.825]
#ax[0,0].set_xlim(oii_emitters)
ax[0,0].axvline(oii_emitters[0],c='k',ls='--')
ax[0,0].axvline(oii_emitters[1],c='k',ls='--')
Out[799]:
<matplotlib.lines.Line2D at 0x1427e8160>
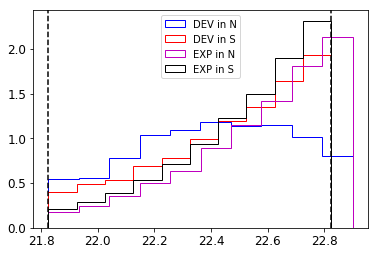
In [800]:
fig,ax= plt.subplots()
bins=None
_=ax.hist(eboss.loc[(isNGC) & (isDEV) & (isSmall),'g'],histtype='step',normed=True,
                  color='b',bins=bins,label='DEV in N')
_=ax.hist(eboss.loc[(~isNGC) & (isDEV) & (isSmall),'g'],histtype='step',normed=True,
                  color='r',bins=bins,label='DEV in S')
_=ax.hist(eboss.loc[(isNGC) & (~isDEV) & (isSmall),'g'],histtype='step',normed=True,
                  color='m',bins=bins,label='EXP in N')
_=ax.hist(eboss.loc[(~isNGC) & (~isDEV) & (isSmall),'g'],histtype='step',normed=True,
                  color='k',bins=bins,label='EXP in S')
ax.legend() #loc='upper left')

#gband
oii_emitters= [21.825, 22.825]
#ax[0,0].set_xlim(oii_emitters)
ax.axvline(oii_emitters[0],c='k',ls='--')
ax.axvline(oii_emitters[1],c='k',ls='--')
Out[800]:
<matplotlib.lines.Line2D at 0x17108efd0>
In [801]:
attrs= ['g','r','z','redshift','fwhm_or_rhalf']
fig,ax= plt.subplots(2,3,figsize=(12,9))
i=-1
for row in range(2):
    for col in range(3):
        i+=1
        if i >= len(attrs):
            continue
        bins=None
        if attrs[i] == 'redshift':
            bins=np.linspace(0,2,20)
        if attrs[i] == 'fwhm_or_rhalf':
            bins=np.linspace(0,10,40)
        _=ax[row,col].hist(eboss.loc[(~isNGC) & (isDEV) & (isSmall),attrs[i]],histtype='step',normed=True,
                           color='b',bins=bins,label='DEV in S')
        _=ax[row,col].hist(eboss.loc[(isNGC) & (~isDEV) & (isSmall),attrs[i]],histtype='step',normed=True,
                           color='r',bins=bins,label='EXP in N')
        _=ax[row,col].hist(eboss.loc[(~isNGC) & (~isDEV) & (isSmall),attrs[i]],histtype='step',normed=True,
                           color='k',bins=bins,label='ExP in S')
        ax[row,col].set_xlabel(attrs[i])
        if i == 0:
            ax[row,col].legend(loc='upper left')
ax[1,0].set_xlim(0,2)

#gband
oii_emitters= [21.825, 22.825]
#ax[0,0].set_xlim(oii_emitters)
ax[0,0].axvline(oii_emitters[0],c='k',ls='--')
ax[0,0].axvline(oii_emitters[1],c='k',ls='--')

print('Frac in NGC',eboss[(isNGC) & (isSmall)].shape[0]/eboss[(isSmall)].shape[0])
print('Frac in SGC',eboss[(~isNGC) & (isSmall)].shape[0]/eboss[(isSmall)].shape[0])
Frac in NGC 0.3051520987009596
Frac in SGC 0.6948479012990404
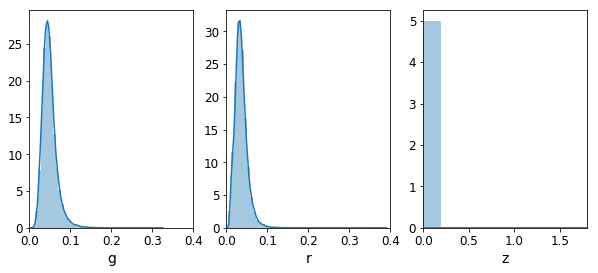
In [802]:
def ivar_ext_corr(flux_ivar, mw_trans):
    return flux_ivar * np.power(mw_trans,2)


def fluxErrorsToMagErrors(flux, flux_invvar):
    """From Dustin Lang's tractor.brightness module
    NanoMaggies().fluxErrorsToMagErrors
    """
    flux = np.atleast_1d(flux)
    flux_invvar = np.atleast_1d(flux_invvar)
    dflux = np.zeros(len(flux))
    okiv = (flux_invvar > 0)
    dflux[okiv] = (1./np.sqrt(flux_invvar[okiv]))
    okflux = (flux > 0)
    mag = np.zeros(len(flux))
    mag[okflux] = (flux2mag(flux[okflux]))
    dmag = np.zeros(len(flux))
    ok = (okiv * okflux)
    dmag[ok] = (np.abs((-2.5 / np.log(10.)) * dflux[ok] / flux[ok]))
    mag[np.logical_not(okflux)] = np.nan
    dmag[np.logical_not(ok)] = np.nan
    return mag.astype(np.float32), dmag.astype(np.float32)


exp_df= eboss.loc[(~isNGC) & (~isDEV) & (isSmall)]
a={}
for b in 'grz':
    #print(exp_df[b+'_mw_transmission'].values)
    flux_EC= exp_df[b+'flux']/exp_df[b+'_mw_transmission']
    ivar_EC= ivar_ext_corr(exp_df[b+'fluxivar'],
                           exp_df[b+'_mw_transmission'])
    a[b],a[b+'_err']= fluxErrorsToMagErrors(flux_EC,ivar_EC)
    print('max diff',np.max(a[b] - exp_df[b]))
max diff 0.0
max diff 0.0
max diff 0.0
In [ ]:
exp_df['zfluxivar'] > 0.1
In [508]:
exp_df.loc[:,['gflux','gfluxivar','rflux','rfluxivar','zflux','zfluxivar',]].describe()
Out[508]:
| gflux | gfluxivar | rflux | rfluxivar | zflux | zfluxivar | |
|---|---|---|---|---|---|---|
| count | 77707.000000 | 77707.000000 | 77707.000000 | 77707.000000 | 77707.000000 | 77707.000000 |
| mean | 0.888922 | 881.916504 | 1.707809 | 548.811218 | 4.328659 | 52.991436 |
| std | 0.224979 | 612.729980 | 0.497227 | 593.549988 | 1.494015 | 37.039284 |
| min | 0.423581 | 15.386562 | 0.813217 | 4.425666 | 1.855282 | 0.000009 |
| 25% | 0.722753 | 531.541199 | 1.348789 | 249.192551 | 3.235148 | 28.715761 |
| 50% | 0.823451 | 766.096497 | 1.585970 | 381.044220 | 3.992064 | 44.390278 |
| 75% | 0.997608 | 1069.143066 | 1.948330 | 586.753754 | 5.091161 | 66.973400 |
| max | 1.758362 | 11717.317383 | 4.004512 | 7636.661621 | 14.356393 | 569.374512 |
In [504]:
pd.DataFrame(a).describe()
Out[504]:
| g | g_err | r | r_err | z | z_err | |
|---|---|---|---|---|---|---|
| count | 77707.000000 | 77707.000000 | 77707.000000 | 77707.000000 | 77707.000000 | 77707.000000 |
| mean | 22.517084 | 0.048797 | 21.864561 | 0.036079 | 20.913521 | 0.044286 |
| std | 0.241931 | 0.017435 | 0.288296 | 0.015156 | 0.347103 | 0.199887 |
| min | 21.825092 | 0.008628 | 20.921309 | 0.004216 | 19.572298 | 0.005758 |
| 25% | 22.367023 | 0.037267 | 21.682262 | 0.026140 | 20.679452 | 0.031045 |
| 50% | 22.574741 | 0.046364 | 21.904720 | 0.034198 | 20.943573 | 0.040345 |
| 75% | 22.715694 | 0.056969 | 22.078629 | 0.043640 | 21.171512 | 0.052133 |
| max | 22.824989 | 0.320735 | 22.450010 | 0.385943 | 21.730873 | 55.529587 |
In [507]:
len(a['g'][a['z_err'] > 50])
Out[507]:
1
In [672]:
fig,ax= plt.subplots(1,3,figsize=(10,4))
for i,b in zip(range(3),'grz'):
    bins=None
    if b == 'z':
        bins= np.arange(0,2,0.2)
    sns.distplot(a[b+'_err'],ax=ax[i],bins=bins)
    ax[i].set_xlabel(b)
for i in range(2):
    ax[i].set_xlim(0,0.4)
ax[2].set_xlim(bins[0],bins[-1])
#plt.xlim(-0.5,0.5)
Out[672]:
(0.0, 1.8)
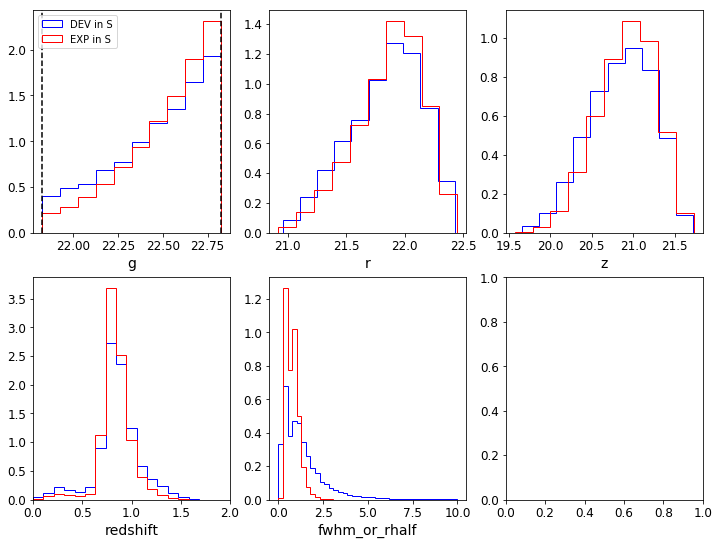
Model (only use SGC data)
Colors, sizes, shapes
In [803]:
attrs= ['g','r','z','redshift','fwhm_or_rhalf']
fig,ax= plt.subplots(2,3,figsize=(12,9))
i=-1
for row in range(2):
    for col in range(3):
        i+=1
        if i >= len(attrs):
            continue
        bins=None
        if attrs[i] == 'redshift':
            bins=np.linspace(0,2,20)
        if attrs[i] == 'fwhm_or_rhalf':
            bins=np.linspace(0,10,40)
        _=ax[row,col].hist(eboss.loc[(~isNGC) & (isDEV) & (isSmall),attrs[i]],histtype='step',normed=True,
                           color='b',bins=bins,label='DEV in S')
        _=ax[row,col].hist(eboss.loc[(~isNGC) & (~isDEV) & (isSmall),attrs[i]],histtype='step',normed=True,
                           color='r',bins=bins,label='EXP in S')
        ax[row,col].set_xlabel(attrs[i])
        if i == 0:
            ax[row,col].legend(loc='upper left')
ax[1,0].set_xlim(0,2)

#gband
oii_emitters= [21.825, 22.825]
#ax[0,0].set_xlim(oii_emitters)
ax[0,0].axvline(oii_emitters[0],c='k',ls='--')
ax[0,0].axvline(oii_emitters[1],c='k',ls='--')

num_in_s=dict(isDEV=eboss[(~isNGC) & (isDEV) & (isSmall)].shape[0],
              notDEV=eboss[(~isNGC) & (~isDEV) & (isSmall)].shape[0],
              total=eboss[(isSmall) & (~isNGC)].shape[0])
print('DEV in S: Number=%d, Frac=%.3f' % (num_in_s['isDEV'],num_in_s['isDEV']/num_in_s['total']))
print('EXP in S: Number=%d, Frac=%.3f' % (num_in_s['notDEV'],num_in_s['notDEV']/num_in_s['total']))
DEV in S: Number=7448, Frac=0.087
EXP in S: Number=77707, Frac=0.913
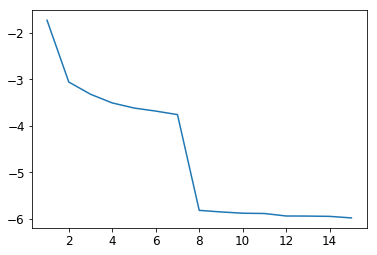
In [674]:
fit_cols= ['fwhm_or_rhalf', 'g-r', 'r-z','z','redshift']
eboss_notdev= eboss.loc[(~isNGC) & (~isDEV) & (isSmall), fit_cols]
eboss_dev= eboss.loc[(~isNGC) & (isDEV) & (isSmall), fit_cols]
X= eboss_notdev.values

gmms,i_min, n_comp, BICs= my_mixture(X)
plt.plot(n_comp,BICs)
15 components
Out[674]:
[<matplotlib.lines.Line2D at 0x22c3c4748>]
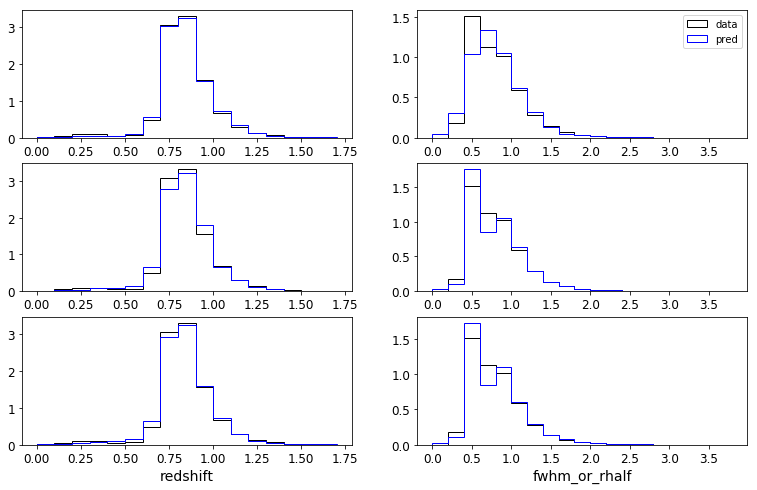
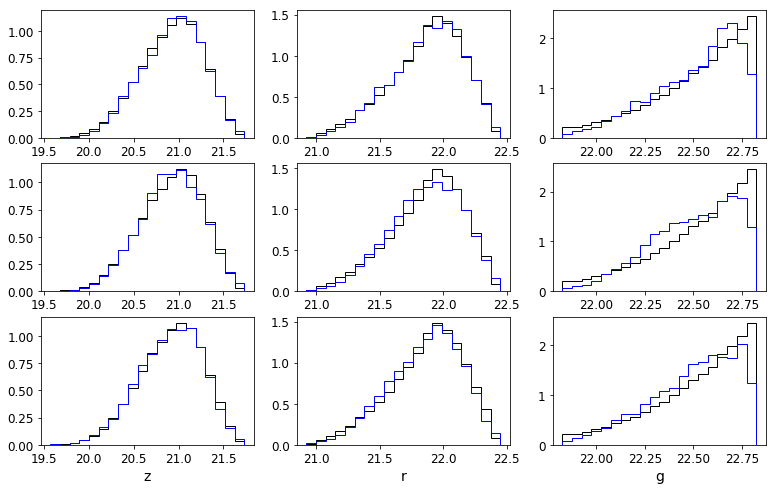
Cannot model power law (g-mag histogram) with Gaussians
In [474]:
fig,ax= plt.subplots(3,2,figsize=(13,8))

zbins=np.arange(0.,1.8,0.1)
fwhm_bins=np.arange(0,4,0.2)
for row,n in enumerate([6,9,12]):
    i= np.where(n_comp == n)[0][0]
    Xpred,Ypred= gmms[i].sample(10000)
    _,bins,_= ax[row,0].hist(eboss_notdev['redshift'],bins=zbins,histtype='step',color='k',normed=True)
    _=ax[row,0].hist(Xpred[:,-1],bins=zbins,histtype='step',color='b',normed=True)

    _,bins,_= ax[row,1].hist(eboss_notdev['fwhm_or_rhalf'],bins=fwhm_bins,histtype='step',color='k',normed=True,
                             label='data')
    _=ax[row,1].hist(Xpred[:,0],bins=fwhm_bins,histtype='step',color='b',normed=True,
                     label='pred')
    #ax[2].set_xlabel('fwhm_or_rhalf')

ax[2,0].set_xlabel('redshift')
ax[2,1].set_xlabel('fwhm_or_rhalf')
ax[0,1].legend()

### g,r,z
#fit_cols= ['fwhm_or_rhalf', 'g-r', 'r-z','z','redshift']
fig,ax= plt.subplots(3,3,figsize=(13,8))

for row,n in enumerate([6,9,12]):
    i= np.where(n_comp == n)[0][0]
    Xpred,Ypred= gmms[i].sample(10000)
    # each band: z,r,g
    _,bins,_= ax[row,0].hist(eboss_notdev['z'],bins=20,histtype='step',color='k',normed=True)
    _=ax[row,0].hist(Xpred[:,-2],bins=bins,histtype='step',color='b',normed=True)
    ax[row,0].set_xlabel('z')

    _,bins,_= ax[row,1].hist(eboss_notdev['r-z'] + eboss_notdev['z'],bins=20,histtype='step',color='k',normed=True)
    _=ax[row,1].hist(Xpred[:,-3] + Xpred[:,-2],bins=bins,histtype='step',color='b',normed=True)
    ax[row,1].set_xlabel('r')

    _,bins,_= ax[row,2].hist(eboss_notdev['g-r'] + eboss_notdev['r-z'] + eboss_notdev['z'],bins=20,histtype='step',color='k',normed=True)
    _=ax[row,2].hist(Xpred[:,-4] + Xpred[:,-3] + Xpred[:,-2],bins=bins,histtype='step',color='b',normed=True)
    ax[row,2].set_xlabel('g')

for i,b in zip(range(3),'zrg'):
    ax[-1,i].set_xlabel(b)
In [592]:
def ebossInSGC(rz,gr):
    return ((-0.068*rz + 0.457 < gr) &
            (gr < 0.112*rz + 0.773) &
            (0.218*gr + 0.571 < rz) &
            (rz < -0.555*gr + 1.901))

def ebossInNGC(rz,gr):
    return ((-0.068*rz + 0.457 < gr) &
            (gr < 0.112*rz + 0.773) &
            (0.637*gr + 0.399 < rz) &
            (rz < -0.555*gr + 1.901))

class EbossBox(object):
    def get_xy_pad(self,slope,pad=0):
        """Returns dx,dy"""
        theta= np.arctan(abs(slope))
        return pad*np.sin(theta), pad*np.cos(theta)

    def get_yint_pad(self,slope,pad=0):
        """Returns dx,dy"""
        theta= np.arctan(slope)
        return pad / np.cos(theta)

    def three_lines(self,rz,pad=0):
        slopes= np.array([-0.068,0.112, 1/(-0.555)])
        yints=  np.array([0.457,0.773,-1.901/(-0.555)])
        lines= []
        for cnt,slope,yint in zip(range(len(slopes)),slopes,yints):
            dy= 0
            #dx,dy= self.get_xy_pad(slope,pad)
            dy= self.get_yint_pad(slope,pad)
            if cnt == 0:
                dy *= -1
            #lines.append(slope*(rz-dx) + yint + dy)
            lines.append(slope*rz + yint + dy)
        return tuple(lines)

    def sgc_line(self,rz,pad=0):
        slope,yint= 1/0.218, -0.571/0.218
        dy=0.
        #dx,dy= self.get_xy_pad(slope,pad)
        dy= self.get_yint_pad(slope,pad)
        return slope*rz + yint + dy

    def ngc_line(self,rz,pad=0):
        slope,yint= 1/0.637, -0.399/0.637
        #dx,dy= self.get_xy_pad(slope,pad)
        dy= self.get_yint_pad(slope,pad)
        return slope*rz + yint + dy

    def SGC(self,rz, pad):
        """
        Args:
            rz: r-z
            pad: magnitudes of padding to expand TS box
        """
        d['y1'],d['y2'],d['y3']= self.three_lines(rz,pad)
        d['y4']= self.sgc_line(rz,pad)
        return d

    def NGC(self,rz, pad):
        """
        Args:
            rz: r-z
            pad: magnitudes of padding to expand TS box
        """
        d['y1'],d['y2'],d['y3']= self.three_lines(rz,pad)
        d['y4']= self.ngc_line(rz,pad)
        return d
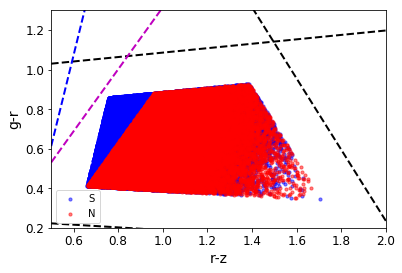
TS box with padding (0.5 mag)
In [582]:
plt.scatter(df.loc[(~isNGC) & (~isDEV) & (isSmall),'r-z'],
              df.loc[(~isNGC) & (~isDEV) & (isSmall),'g-r'],
              c='b',s=10,alpha=0.5,label='S')
plt.scatter(df.loc[(isNGC) & (~isDEV) & (isSmall),'r-z'],
              df.loc[(isNGC) & (~isDEV) & (isSmall),'g-r'],
              c='r',s=10,alpha=0.5,label='N')

rz= np.linspace(0.5,2,num=20)
ngc_d= EbossBox().NGC(rz,pad=0.2)
plt.plot(rz,ngc_d['y1'],'k--',lw=2)
plt.plot(rz,ngc_d['y2'],'k--',lw=2)
plt.plot(rz,ngc_d['y3'],'k--',lw=2)
plt.plot(rz,ngc_d['y4'],'m--',lw=2)

sgc_d= EbossBox().SGC(rz,pad=0.2)
plt.plot(rz,sgc_d['y4'],'b--',lw=2)


plt.legend()
plt.xlim(0.5,2)
plt.ylim(0.2,1.3)
plt.xlabel('r-z')
plt.ylabel('g-r')
Out[582]:
<matplotlib.text.Text at 0x17516d710>
Add DR3-Deep2 to Model
In [879]:
DATA_DIR = os.path.join(os.environ['HOME'],'Downloads',
                        'truth')
dr3_fns= glob(os.path.join(DATA_DIR,
                'dr3.1/trimmed/decals-dr3.1-deep2-field*-trim.fits'))
dp2_fns= glob(os.path.join(DATA_DIR,
                'dr3.1/trimmed/deep2-field*-trim.fits'))
print(dr3_fns,dp2_fns)
###
def stack_tables(fns):
    cat=[]
    assert(len(fns) > 0)
    for fn in fns:
        assert(os.path.exists(fn))
        print('Stacking %s' % fn)
        cat.append( fits_table(fn) )
    return merge_tables(cat, columns='fillzero')

dr3= stack_tables(dr3_fns)
dp2= stack_tables(dp2_fns)
print(len(dr3),len(dp2))
#######
grz_gt0= (np.all(dr3.decam_flux[:,[1,2,4]] > 0,axis=1) &
          np.all(dr3.decam_flux_ivar[:,[1,2,4]] > 0,axis=1))
notCOMP= dr3.type != 'COMP'
###
fwhm_or_rhalf= np.zeros(len(dr3))-1 # arcsec
isPSF= dr3.type == 'PSF'
isEXP= dr3.type == 'EXP'
isSIMP= dr3.type == 'SIMP'
isDEV= dr3.type == 'DEV'
fwhm_or_rhalf[isPSF]= np.mean(dr3[isPSF].decam_psfsize[:,[1,2,4]],axis=1)
fwhm_or_rhalf[isSIMP]= 0.5
fwhm_or_rhalf[isEXP]= dr3[isEXP].shapeexp_r
fwhm_or_rhalf[isDEV]= dr3[isDEV].shapedev_r
dr3.set('fwhm_or_rhalf',fwhm_or_rhalf)
###
reshift_lims= [0,2.] # eBOSS
###
keep= ((grz_gt0) &
       (notCOMP) &
       (fwhm_or_rhalf < 5) &
       (dp2.zhelio > reshift_lims[0]) &
       (dp2.zhelio < reshift_lims[1]))
dr3.cut(keep)
dp2.cut(keep)
###
d= {}
for i,b in zip([1,2,4],'grz'):
    d[b]= flux2mag(dr3.get('decam_flux')[:,i]/dr3.get('decam_mw_transmission')[:,i])
    #d[b+'_ivar']= flux2mag(dr3.get('decam_flux_ivar')[:,i]/dr3.get('decam_mw_transmission')[:,i])
d['redshift']= dp2.get('zhelio')
d['fwhm_or_rhalf']= dr3.fwhm_or_rhalf
d['type']= dr3.get('type')
dr3_deep2= pd.DataFrame(d)
###
print(df['type'].value_counts()/df.shape[0])
isDEV= dr3_deep2['type'] == 'DEV'
dr3_deep2['r-z']= dr3_deep2['r'] - dr3_deep2['z']
dr3_deep2['g-r']= dr3_deep2['g'] - dr3_deep2['r']
dr3_deep2['brickid']= dr3.brickid
dr3_deep2['objid']= dr3.objid
['/Users/kaylan1/Downloads/truth/dr3.1/trimmed/decals-dr3.1-deep2-field2-trim.fits', '/Users/kaylan1/Downloads/truth/dr3.1/trimmed/decals-dr3.1-deep2-field3-trim.fits', '/Users/kaylan1/Downloads/truth/dr3.1/trimmed/decals-dr3.1-deep2-field4-trim.fits'] ['/Users/kaylan1/Downloads/truth/dr3.1/trimmed/deep2-field2-trim.fits', '/Users/kaylan1/Downloads/truth/dr3.1/trimmed/deep2-field3-trim.fits', '/Users/kaylan1/Downloads/truth/dr3.1/trimmed/deep2-field4-trim.fits']
Stacking /Users/kaylan1/Downloads/truth/dr3.1/trimmed/decals-dr3.1-deep2-field2-trim.fits
Converted brickname from |S8 to <U8
Converted type from |S4 to <U4
Stacking /Users/kaylan1/Downloads/truth/dr3.1/trimmed/decals-dr3.1-deep2-field3-trim.fits
Converted brickname from |S8 to <U8
Converted type from |S4 to <U4
Stacking /Users/kaylan1/Downloads/truth/dr3.1/trimmed/decals-dr3.1-deep2-field4-trim.fits
Converted brickname from |S8 to <U8
Converted type from |S4 to <U4
Stacking /Users/kaylan1/Downloads/truth/dr3.1/trimmed/deep2-field2-trim.fits
Converted source from |S12 to <U12
Converted vis_morph from |S1 to <U1
Stacking /Users/kaylan1/Downloads/truth/dr3.1/trimmed/deep2-field3-trim.fits
Converted source from |S12 to <U12
Converted vis_morph from |S1 to <U1
Stacking /Users/kaylan1/Downloads/truth/dr3.1/trimmed/deep2-field4-trim.fits
Converted source from |S12 to <U12
Converted vis_morph from |S1 to <U1
28284 28284
EXP     0.600738
SIMP    0.284612
DEV     0.085009
PSF     0.029642
Name: type, dtype: float64
DR3-Deep2 for outside the TS box
In [880]:
def eboss_scatterplot(rz,gr,redshift,
                      fig,ax,pad=0.):
    """Given cleaned gr,gr, and redshifts, cuts to padded SGC region
    and plots scatter plot colored by redshift"""
    #inSGC= ebossInSGC(df['r-z'],df['g-r'])
    sgc_d= EbossBox().SGC(rz,pad=mag_pad)
    inSGC= ((gr > sgc_d['y1']) &
            (gr < sgc_d['y2']) &
            (gr < sgc_d['y3']) &
            (gr < sgc_d['y4']))

    import matplotlib.colors as colors
    vmin= redshift[inSGC].min()
    vmax= redshift[inSGC].max()
    bounds= np.arange(vmin,vmax+0.2,0.2)
    norm = colors.BoundaryNorm(boundaries=bounds, ncolors=256)
    scat= ax.scatter(rz[inSGC], gr[inSGC],
                     c=redshift[inSGC],s=10,alpha=1,
                     vmin=vmin,vmax=vmax,norm=norm)
    rz_pts= np.linspace(0.4,2.1,num=20)
    sgc_d= EbossBox().SGC(rz_pts,pad=mag_pad)
    for key in ['y1','y2','y3','y4']:
        ax.plot(rz_pts,sgc_d[key],'k--',lw=2)
    # eBOSS Box
    sgc_d= EbossBox().SGC(rz_pts,pad=0.)
    for key in ['y1','y2','y3','y4']:
        ax.plot(rz_pts,sgc_d[key],'m--',lw=3)

    ax.set_xlabel('r-z')
    ax.set_ylabel('g-r')
    ax.set_xlim(rz_pts[0],rz_pts[-1])
    ax.set_ylim(0,1.2)
    print(len(rz))

    from mpl_toolkits.axes_grid1 import make_axes_locatable
    divider = make_axes_locatable(ax)
    cax = divider.append_axes('right', size='5%', pad=0.05)
    fig.colorbar(scat, cax=cax, orientation='vertical')

# eBOSS data
redshift_lims= [0,2] # eBOSS
eboss_cut= ((~isNGC) &
            (isSmall) &
            (eboss['redshift'] >= redshift_lims[0]) &
            (eboss['redshift'] <= redshift_lims[1]))
# type
isDEV= dict(dr3= dr3_deep2['type'].str.strip() == 'DEV',
            eboss= eboss_zcut['type'].str.strip() == 'DEV')


pad=0.2
fig,ax=plt.subplots(2,2,figsize=(16,14))
eboss_scatterplot(dr3_deep2.loc[~isDEV['dr3'],'r-z'],dr3_deep2.loc[~isDEV['dr3'],'g-r'],
                  dr3_deep2.loc[~isDEV['dr3'],'redshift'],
                  fig,ax[0,0],pad=pad)
eboss_scatterplot(eboss.loc[(eboss_cut) & (~isDEV['eboss']),'r-z'],
                  eboss.loc[(eboss_cut) & (~isDEV['eboss']),'g-r'],
                  eboss.loc[(eboss_cut) & (~isDEV['eboss']),'redshift'],
                  fig,ax[0,1],pad=pad)
ax[0,0].set_title('EXP, DR3-DEEP2')
ax[0,1].set_title('EXP, eBOSS')

# DEV
eboss_scatterplot(dr3_deep2.loc[isDEV['dr3'],'r-z'],dr3_deep2.loc[isDEV['dr3'],'g-r'],
                  dr3_deep2.loc[isDEV['dr3'],'redshift'],
                  fig,ax[1,0],pad=pad)
eboss_scatterplot(eboss.loc[(eboss_cut) & (isDEV['eboss']),'r-z'],
                  eboss.loc[(eboss_cut) & (isDEV['eboss']),'g-r'],
                  eboss.loc[(eboss_cut) & (isDEV['eboss']),'redshift'],
                  fig,ax[1,1],pad=pad)
ax[1,0].set_title('DEV, DR3-DEEP2')
ax[1,1].set_title('DEV, eBOSS')
25473
77525
927
7439
Out[880]:
<matplotlib.text.Text at 0x1948a8630>
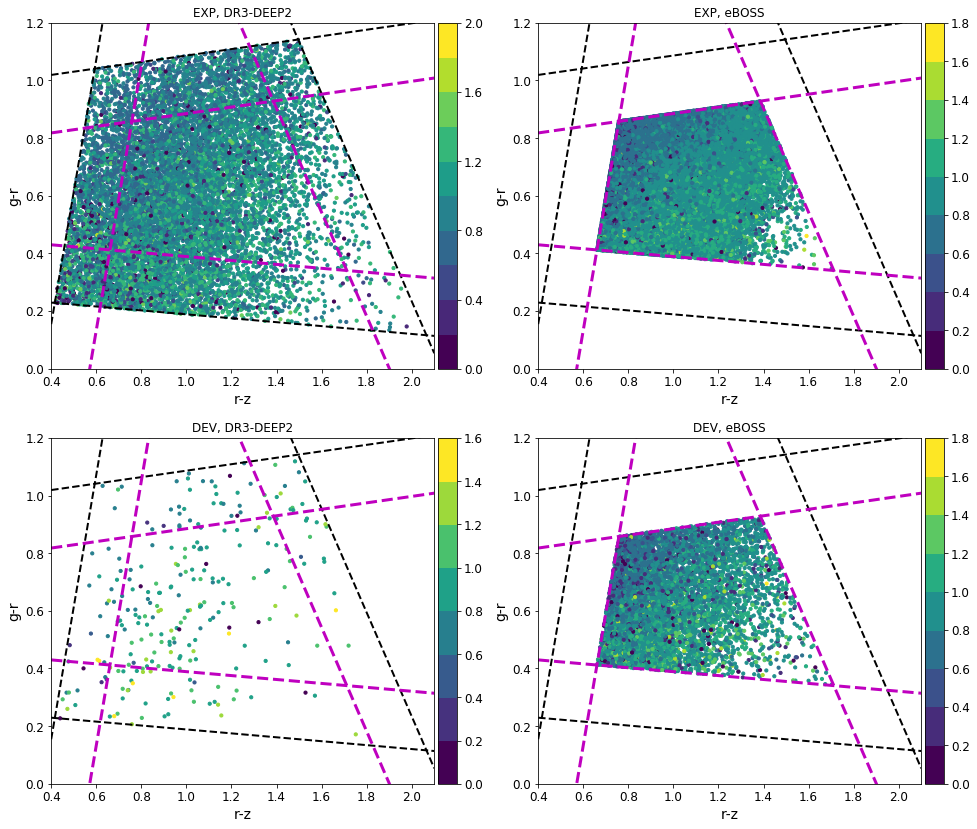
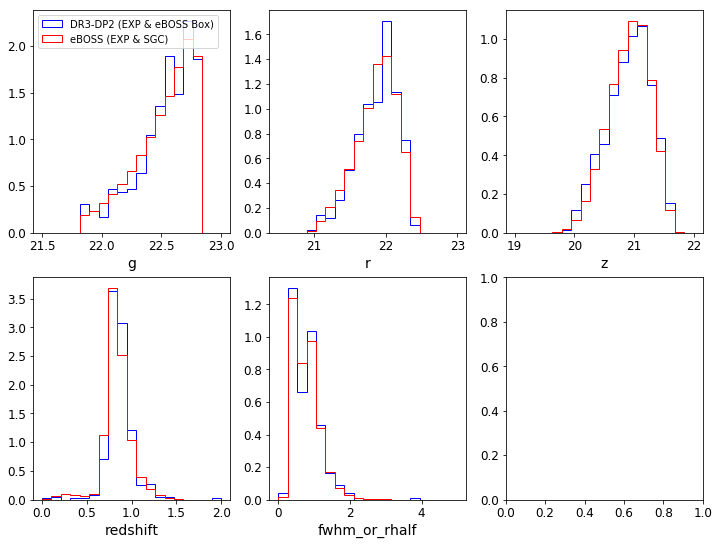
DR3-Deep2 reproduces SGC data when cut to TS box!
In [882]:
pad=0.
sgc_d= EbossBox().SGC(dr3_deep2['r-z'],pad=pad)
inSGC= ((dr3_deep2['g-r'] > sgc_d['y1']) &
        (dr3_deep2['g-r'] < sgc_d['y2']) &
        (dr3_deep2['g-r'] < sgc_d['y3']) &
        (dr3_deep2['g-r'] < sgc_d['y4']))

reshift_lims= [0,2.] # eBOSS
eboss_cut= ((~isNGC) &
            (~isDEV['eboss']) &
            (isSmall) &
            (eboss['redshift'] >= reshift_lims[0]) &
            (eboss['redshift'] <= reshift_lims[1]))

g_min,g_max= eboss.loc[eboss_cut,'g'].min(), eboss.loc[eboss_cut,'g'].max()
dr3_cut= ((inSGC) &
          (dr3_deep2['g'] >= g_min) &
          (dr3_deep2['g'] <= g_max + pad) &
          (~isDEV['dr3']))


attrs= ['g','r','z','redshift','fwhm_or_rhalf']
bins=dict(g=np.linspace(21.5,23,20),
          r=np.linspace(20.5,23,20),
          z=np.linspace(19,22,20),
          redshift=np.linspace(0,2,20),
          fwhm_or_rhalf=np.linspace(0,5,20))
fig,ax= plt.subplots(2,3,figsize=(12,9))
i=-1
for row in range(2):
    for col in range(3):
        i+=1
        if i >= len(attrs):
            continue
        _=ax[row,col].hist(dr3_deep2.loc[dr3_cut,attrs[i]],
                           histtype='step',normed=True,
                           color='b',bins=bins[attrs[i]],label='DR3-DP2 (EXP & eBOSS Box)')
        _=ax[row,col].hist(eboss.loc[eboss_cut,attrs[i]],
                           histtype='step',normed=True,
                           color='r',bins=bins[attrs[i]],label='eBOSS (EXP & SGC)')
        ax[row,col].set_xlabel(attrs[i])
        if i == 0:
            ax[row,col].legend(loc='upper left')

print('DR3-DP2: Number=%d' % dr3_deep2[dr3_cut].shape[0])
print('eBOSS: Number=%d' % eboss[eboss_cut].shape[0])
DR3-DP2: Number=374
eBOSS: Number=77525
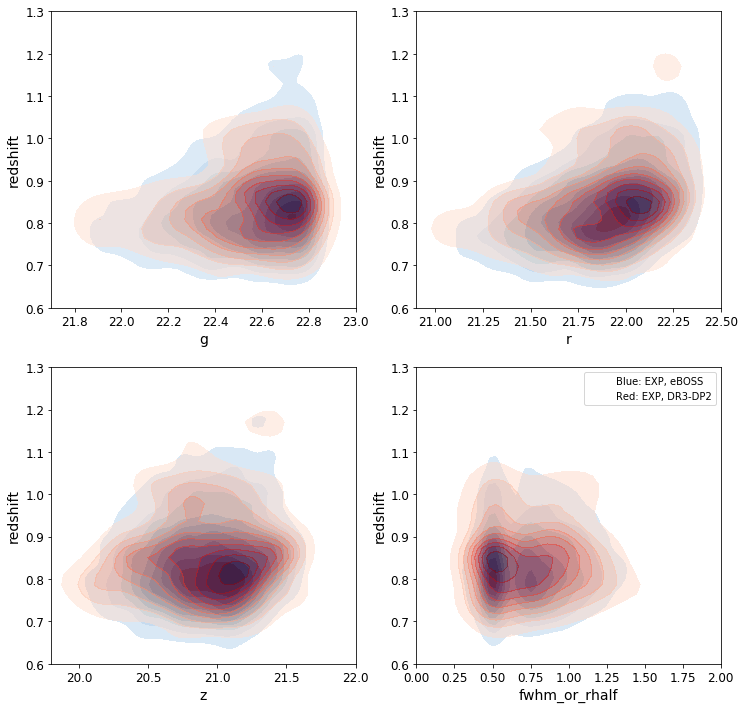
Redshift correlations also reproduced!
In [883]:
## Reduce size of eboss_zcut so can plot
iboot=np.random.randint(0,eboss[eboss_cut].shape[0],size=5000)
kwargs= dict(shade=True, shade_lowest=False)
##

attrs= ['g','r','z','fwhm_or_rhalf']
xylims=dict(g=(21.7,23),
          r=(20.9,22.5),
          z=(19.8,22),
          redshift=(0.6,1.3),
          fwhm_or_rhalf=(0,2))
fig,ax= plt.subplots(2,2,figsize=(12,12))
i=-1
for row in range(2):
    for col in range(2):
        i+=1
        if i >= len(attrs):
            continue
#         ax[row,col].scatter(eboss_zcut.loc[~isDEV['eboss'],attrs[i]],
#                             eboss_zcut.loc[~isDEV['eboss'],'redshift'],
#                             c='b',s=10,alpha=0.5,label='EXP, eBOSS')
#         ax[row,col].scatter(dr3_deep2_gcut[attrs[i]],
#                             dr3_deep2_gcut['redshift'],
#                             c='r',s=10,alpha=0.5,label='EXP, DR3-DP2')
        sns.kdeplot(eboss.loc[eboss_cut,attrs[i]].iloc[iboot],
                    eboss.loc[eboss_cut,'redshift'].iloc[iboot],
                    ax= ax[row,col], cmap='Blues', label='EXP, eBOSS',**kwargs)
        sns.kdeplot(dr3_deep2.loc[dr3_cut,attrs[i]],
                    dr3_deep2.loc[dr3_cut,'redshift'],
                    ax= ax[row,col], cmap="Reds", label='EXP, DR3-DP2',alpha=0.5,**kwargs)
        ax[row,col].set_xlim(xylims[attrs[i]])
        ax[row,col].set_ylim(xylims['redshift'])
        ax[row,col].set_xlabel(attrs[i])
ax[1,1].legend(['Blue: EXP, eBOSS',
                'Red: EXP, DR3-DP2'],loc='upper right')
Out[883]:
<matplotlib.legend.Legend at 0x18651bac8>
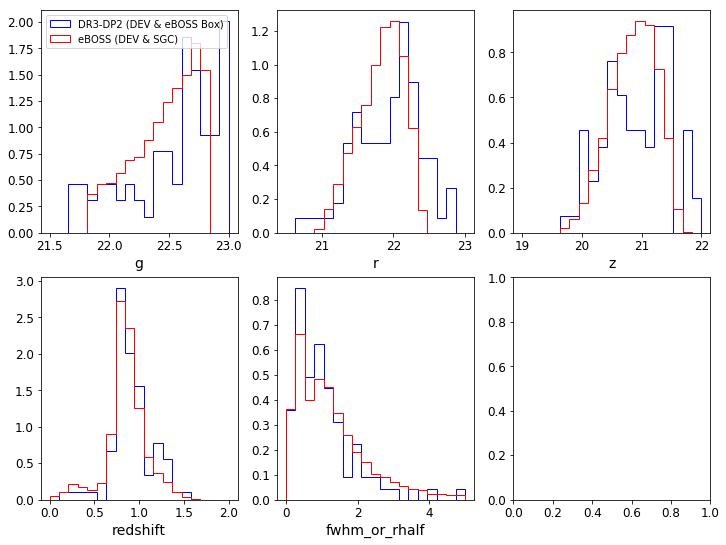
DEV from DR3-Deep2 span redshifts [0,2] and 0.2 mag deeper than SGC g-mag, so will can model this even though just 79 data points
In [884]:
pad=0.2
sgc_d= EbossBox().SGC(dr3_deep2['r-z'],pad=pad)
inSGC= ((dr3_deep2['g-r'] > sgc_d['y1']) &
        (dr3_deep2['g-r'] < sgc_d['y2']) &
        (dr3_deep2['g-r'] < sgc_d['y3']) &
        (dr3_deep2['g-r'] < sgc_d['y4']))

reshift_lims= [0,2.] # eBOSS
eboss_cut= ((~isNGC) &
            (isDEV['eboss']) &
            (isSmall) &
            (eboss['redshift'] >= reshift_lims[0]) &
            (eboss['redshift'] <= reshift_lims[1]))

g_min,g_max= eboss.loc[eboss_cut,'g'].min(), eboss.loc[eboss_cut,'g'].max()
dr3_cut= ((inSGC) &
          (dr3_deep2['g'] >= g_min - pad) &
          (dr3_deep2['g'] <= g_max + pad) &
          (isDEV['dr3']))


attrs= ['g','r','z','redshift','fwhm_or_rhalf']
bins=dict(g=np.linspace(21.5,23,20),
          r=np.linspace(20.5,23,20),
          z=np.linspace(19,22,20),
          redshift=np.linspace(0,2,20),
          fwhm_or_rhalf=np.linspace(0,5,20))
fig,ax= plt.subplots(2,3,figsize=(12,9))
i=-1
for row in range(2):
    for col in range(3):
        i+=1
        if i >= len(attrs):
            continue
        _=ax[row,col].hist(dr3_deep2.loc[dr3_cut,attrs[i]],
                           histtype='step',normed=True,
                           color='b',bins=bins[attrs[i]],label='DR3-DP2 (DEV & eBOSS Box)')
        _=ax[row,col].hist(eboss.loc[eboss_cut,attrs[i]],
                           histtype='step',normed=True,
                           color='r',bins=bins[attrs[i]],label='eBOSS (DEV & SGC)')
        ax[row,col].set_xlabel(attrs[i])
        if i == 0:
            ax[row,col].legend(loc='upper left')

print('DR3-DP2: Number DEV=%d' % dr3_deep2[dr3_cut].shape[0])
print('eBOSS: Number DEV=%d' % eboss[eboss_cut].shape[0])
DR3-DP2: Number DEV=85
eBOSS: Number DEV=7439
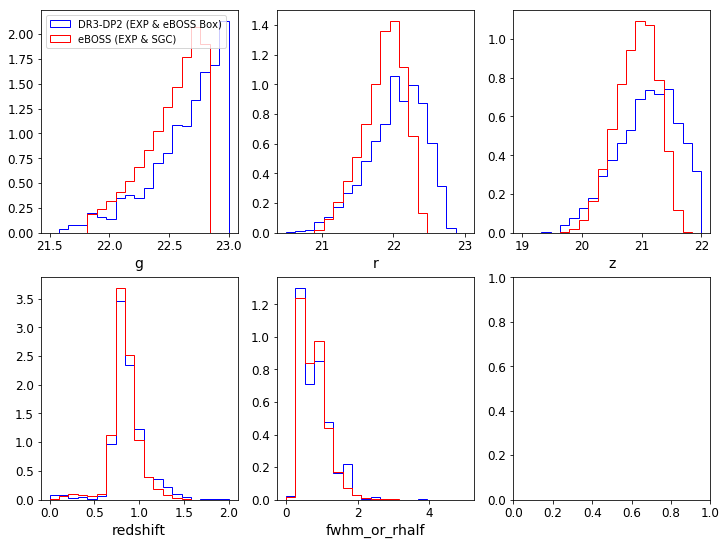
Same padding (0.2 mag) for EXP
In [885]:
pad=0.2
sgc_d= EbossBox().SGC(dr3_deep2['r-z'],pad=pad)
inSGC= ((dr3_deep2['g-r'] > sgc_d['y1']) &
        (dr3_deep2['g-r'] < sgc_d['y2']) &
        (dr3_deep2['g-r'] < sgc_d['y3']) &
        (dr3_deep2['g-r'] < sgc_d['y4']))

redshift_lims= [0,2.] # eBOSS
eboss_cut= ((~isNGC) &
            (~isDEV['eboss']) &
            (isSmall) &
            (eboss['redshift'] >= redshift_lims[0]) &
            (eboss['redshift'] <= redshift_lims[1]))

g_min,g_max= eboss.loc[eboss_cut,'g'].min(), eboss.loc[eboss_cut,'g'].max()
dr3_cut= ((inSGC) &
          (dr3_deep2['g'] >= g_min - pad) &
          (dr3_deep2['g'] <= g_max + pad) &
          (~isDEV['dr3']))


attrs= ['g','r','z','redshift','fwhm_or_rhalf']
bins=dict(g=np.linspace(21.5,23,20),
          r=np.linspace(20.5,23,20),
          z=np.linspace(19,22,20),
          redshift=np.linspace(0,2,20),
          fwhm_or_rhalf=np.linspace(0,5,20))
fig,ax= plt.subplots(2,3,figsize=(12,9))
i=-1
for row in range(2):
    for col in range(3):
        i+=1
        if i >= len(attrs):
            continue
        _=ax[row,col].hist(dr3_deep2.loc[dr3_cut,attrs[i]],
                           histtype='step',normed=True,
                           color='b',bins=bins[attrs[i]],label='DR3-DP2 (EXP & eBOSS Box)')
        _=ax[row,col].hist(eboss.loc[eboss_cut,attrs[i]],
                           histtype='step',normed=True,
                           color='r',bins=bins[attrs[i]],label='eBOSS (EXP & SGC)')
        ax[row,col].set_xlabel(attrs[i])
        if i == 0:
            ax[row,col].legend(loc='upper left')

print('DR3-DP2: Number=%d' % dr3_deep2[dr3_cut].shape[0])
print('eBOSS: Number=%d' % eboss[eboss_cut].shape[0])
DR3-DP2: Number=1066
eBOSS: Number=77525
4 Samples = Model (EXP/DEV and SGC/DR3-Deep2)
In [2]:
print('SGC: ~77k EXP, 7k DEV')
print('DR3-Deep2: ~1k EXP, 100 DEV')
SGC: ~77k EXP, 7k DEV
DR3-Deep2: ~1k EXP, 100 DEV
In [892]:
# Limits
## eBOSS
redshift_lims= [0,2.] # eBOSS
rhalf_lim_exp= (0.262/2, 2.5) # Camera, Data
rhalf_lim_dev= (0.262/2, 5.) # Camera, Data
eboss_cut_gen= ((~isNGC) &
                (isSmall) &
                (eboss['redshift'] >= redshift_lims[0]) &
                (eboss['redshift'] <= redshift_lims[1]))
eboss_cut_exp= ((eboss_cut_gen) &
                (~isDEV['eboss']) &
                (eboss['fwhm_or_rhalf'] >= rhalf_lim_exp[0]) &
                (eboss['fwhm_or_rhalf'] <= rhalf_lim_exp[1]))
eboss_cut_dev= ((eboss_cut_gen) &
                (isDEV['eboss']) &
                (eboss['fwhm_or_rhalf'] >= rhalf_lim_dev[0]) &
                (eboss['fwhm_or_rhalf'] <= rhalf_lim_dev[1]))

## DR3-DP2
g_min= eboss.loc[(eboss_cut_exp) | (eboss_cut_dev),'g'].min()
g_max= eboss.loc[(eboss_cut_exp) | (eboss_cut_dev),'g'].max()
assert(pad==0.2)
dr3_cut_gen= ((inSGC) &
              (dr3_deep2['g'] >= g_min - pad) &
              (dr3_deep2['g'] <= g_max + pad) &
              (dr3_deep2['redshift'] >= redshift_lims[0]) &
              (dr3_deep2['redshift'] <= redshift_lims[1]))
dr3_cut_exp= ((dr3_cut_gen) &
              (~isDEV['dr3']) &
              (dr3_deep2['fwhm_or_rhalf'] >= rhalf_lim_exp[0]) &
              (dr3_deep2['fwhm_or_rhalf'] <= rhalf_lim_exp[1]))
dr3_cut_dev= ((dr3_cut_gen) &
              (isDEV['dr3']) &
              (dr3_deep2['fwhm_or_rhalf'] >= rhalf_lim_dev[0]) &
              (dr3_deep2['fwhm_or_rhalf'] <= rhalf_lim_dev[1]))


save_cols= ['g', 'r','z','fwhm_or_rhalf','redshift']

# DR3-DP2: in 0.2 padded eBOSS TS box
# unique_identfier
dr3_deep2['tractor_id']= dr3_deep2['brickid'].astype(str) + '-' + \
                         dr3_deep2['objid'].astype(str)
fn='eboss_elg_dr3deep2_EXP.csv'
if not os.path.exists(fn):
    (dr3_deep2.loc[dr3_cut_exp,:]
              .set_index('tractor_id')
              .loc[:,save_cols]
              #.head())
              .to_csv(fn, index_label='tractor_id'))
    print('Wrote %s' % fn)
fn='eboss_elg_dr3deep2_DEV.csv'
if not os.path.exists(fn):
    (dr3_deep2.loc[dr3_cut_dev,:]
              .set_index('tractor_id')
              .loc[:,save_cols]
              #.head())
              .to_csv(fn, index_label='tractor_id'))
    print('Wrote %s' % fn)

# eBOSS data
# unique_identfier
eboss['sdss_id']= eboss['plate'].astype(str) + '-' + \
                    eboss['mjd'].astype(str) + '-' + \
                    eboss['fiberid'].astype(str)
# Save ~ 77k eboss data cut to redshift and rhalf limits
# (not doing 10k random without relacement rows from the 77k eBOSS data points)
fn='eboss_elg_tsspectra_EXP.csv'
if not os.path.exists(fn):
    (eboss.loc[eboss_cut_exp,:]
          .set_index('sdss_id')
          .loc[:,save_cols]
          .to_csv(fn, index_label='sdss_id'))
    print('Wrote %s' % fn)
fn='eboss_elg_tsspectra_DEV.csv'
if not os.path.exists(fn):
    (eboss.loc[eboss_cut_dev,:]
          .set_index('sdss_id')
          .loc[:,save_cols]
          .to_csv(fn, index_label='sdss_id'))
    print('Wrote %s' % fn)
Wrote eboss_elg_dr3deep2_EXP.csv
Wrote eboss_elg_dr3deep2_DEV.csv
Wrote eboss_elg_tsspectra_EXP.csv
Wrote eboss_elg_tsspectra_DEV.csv
In [895]:
dr3dp2_exp= pd.read_csv('eboss_elg_dr3deep2_EXP.csv')
dr3dp2_dev= pd.read_csv('eboss_elg_dr3deep2_DEV.csv')
eboss_exp= pd.read_csv('eboss_elg_tsspectra_EXP.csv')
eboss_dev= pd.read_csv('eboss_elg_tsspectra_DEV.csv')
print(dr3dp2_exp.shape[0],dr3dp2_dev.shape[0])
print(eboss_exp.shape[0],eboss_dev.shape[0])
print(dr3dp2_exp.columns)
print(eboss_exp.columns)
1064 85
77367 7229
Index(['tractor_id', 'g', 'r', 'z', 'fwhm_or_rhalf', 'redshift'], dtype='object')
Index(['sdss_id', 'g', 'r', 'z', 'fwhm_or_rhalf', 'redshift'], dtype='object')
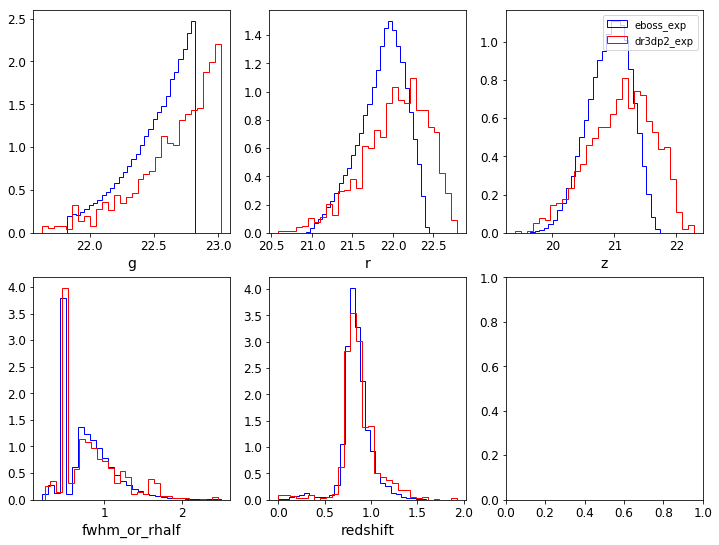
Model for EXP
In [898]:
cols= ['g', 'r', 'z', 'fwhm_or_rhalf','redshift']

fig,ax= plt.subplots(2,3,figsize=(12,9))
i=-1
for row in range(2):
    for col in range(3):
        i+=1
        if i >= len(cols):
            continue
        _=ax[row,col].hist(eboss_exp[cols[i]],
                           histtype='step',normed=True,
                           bins=30,color='b',label='eboss_exp') #bins[col[i]])
        _=ax[row,col].hist(dr3dp2_exp[cols[i]],
                           histtype='step',normed=True,
                           bins=30,color='r',label='dr3dp2_exp') #bins[col[i]])
        ax[row,col].set_xlabel(cols[i])
ax[0,2].legend()
# ax[1,0].set_xlim(-0.2,2)
# ax[1,1].set_xlim(0,2)

print('eboss redshift min,max=',eboss_exp['redshift'].min(),eboss_exp['redshift'].max())
print('dr3dp2 redshift min,max=',dr3dp2_exp['redshift'].min(),dr3dp2_exp['redshift'].max())
print('eboss rhalf min,max=',eboss_exp['fwhm_or_rhalf'].min(),eboss_exp['fwhm_or_rhalf'].max())
print('dr3dp2 rhalf min,max=',dr3dp2_exp['fwhm_or_rhalf'].min(),dr3dp2_exp['fwhm_or_rhalf'].max())
eboss redshift min,max= 5.69866460864e-05 1.6508961916
dr3dp2 redshift min,max= 0.000414778420236 1.93213009834
eboss rhalf min,max= 0.20438374579 2.4978723526
dr3dp2 rhalf min,max= 0.238977983594 2.45425891876
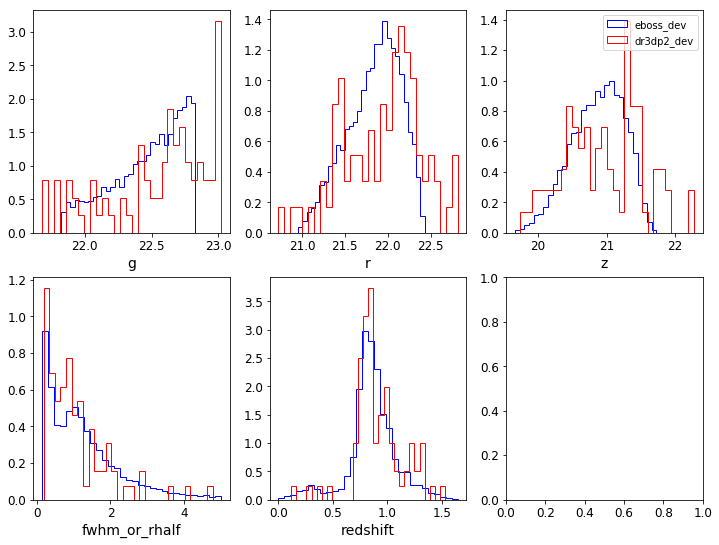
Model for DEV
In [899]:
fig,ax= plt.subplots(2,3,figsize=(12,9))
i=-1
for row in range(2):
    for col in range(3):
        i+=1
        if i >= len(cols):
            continue
        _=ax[row,col].hist(eboss_dev[cols[i]],
                           histtype='step',normed=True,
                           bins=30,color='b',label='eboss_dev') #bins[col[i]])
        _=ax[row,col].hist(dr3dp2_dev[cols[i]],
                           histtype='step',normed=True,
                           bins=30,color='r',label='dr3dp2_dev') #bins[col[i]])
        ax[row,col].set_xlabel(cols[i])
ax[0,2].legend()
# ax[1,0].set_xlim(-0.2,2)
# ax[1,1].set_xlim(0,2)

print('eboss redshift min,max=',eboss_dev['redshift'].min(),eboss_dev['redshift'].max())
print('dr3dp2 redshift min,max=',dr3dp2_dev['redshift'].min(),dr3dp2_dev['redshift'].max())
print('eboss rhalf min,max=',eboss_dev['fwhm_or_rhalf'].min(),eboss_dev['fwhm_or_rhalf'].max())
print('dr3dp2 rhalf min,max=',dr3dp2_dev['fwhm_or_rhalf'].min(),dr3dp2_dev['fwhm_or_rhalf'].max())
eboss redshift min,max= 4.56776215287e-05 1.64284992218
dr3dp2 redshift min,max= 0.114836841822 1.53109943867
eboss rhalf min,max= 0.149582266808 4.99710035324
dr3dp2 rhalf min,max= 0.186883717775 4.76907682419
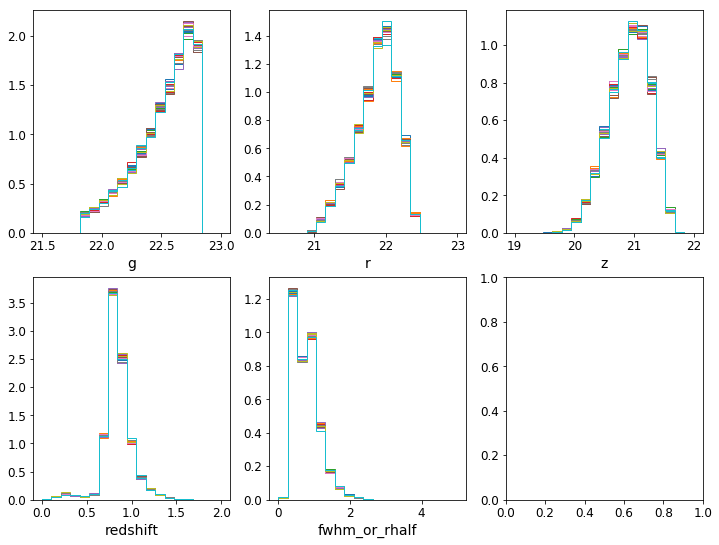
In [893]:
fig,ax= plt.subplots(2,3,figsize=(12,9))

ind= np.arange(eboss[eboss_cut_exp].shape[0])
for ishuff in range(20):
    i=-1
    for row in range(2):
        for col in range(3):
            i+=1
            if i >= len(attrs):
                continue
            np.random.shuffle(ind)
            _=ax[row,col].hist(eboss.loc[eboss_cut_exp,attrs[i]].iloc[ind[:10000]],
                               histtype='step',normed=True,
                               bins=bins[attrs[i]])
            ax[row,col].set_xlabel(attrs[i])
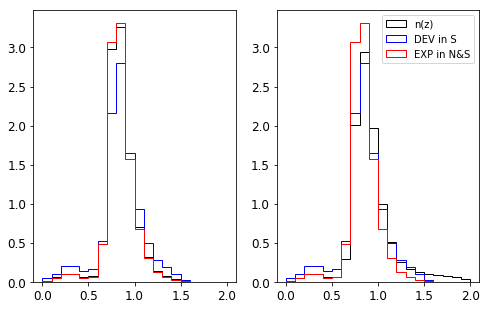
n(z) for eBOSS ELGs
print(‘Right is the n(z) Anand Raichoor provided me, Left is my
reproduction of it’)
In [845]:
zbins= np.arange(0,2.+0.1,0.1)
print('zbins=',zbins)
print('number zs from EXP: ',eboss[(~isNGC) & (~isDEV['eboss']) & (isSmall)].shape[0])
print('number zs from DEV: ',eboss[(~isNGC) & (isDEV['eboss'])  & (isSmall)].shape[0])

fig,ax=plt.subplots(1,2,figsize=(8,5))
for i,wt,name in zip(range(2),[np.ones(eboss.shape[0]), eboss['sector_tsr'].values],
                              ['No wt', 'tsr']):
    nz= (eboss['redshift'] / wt)[(~isNGC) & (isSmall)]
    _=ax[i].hist(nz,histtype='step',normed=True,
              color='k',bins=zbins,label='n(z)')
    _=ax[i].hist(df.loc[(~isNGC) & (isDEV['eboss']) & (isSmall),'redshift'],histtype='step',normed=True,
                color='b',bins=zbins,label='DEV in S')
    _=ax[i].hist(df.loc[(~isNGC) & (~isDEV['eboss']) & (isSmall),'redshift'],histtype='step',normed=True,
                       color='r',bins=zbins,label='EXP in N&S')
ax[1].legend()
zbins= [ 0.   0.1  0.2  0.3  0.4  0.5  0.6  0.7  0.8  0.9  1.   1.1  1.2  1.3  1.4
  1.5  1.6  1.7  1.8  1.9  2. ]
number zs from EXP:  77525
number zs from DEV:  7439
Out[845]:
<matplotlib.legend.Legend at 0x1222303c8>
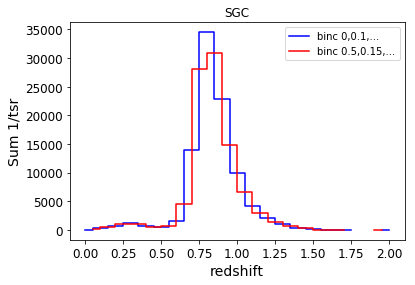
In [846]:
df_z['wt']= 1/df_z['sector_tsr']

zbins= np.arange(-0.05,2.+0.1,0.1)
print('zbins=',zbins)
df_z['bins']= pd.cut(df_z['redshift'],bins=zbins)
nz= df_z.loc[:,['wt','bins']].groupby('bins').agg(np.sum)

zbins2= np.arange(0.,2.+0.1,0.1)
df_z['bins2']= pd.cut(df_z['redshift'],bins=zbins2)
nz2= df_z.loc[:,['wt','bins2']].groupby('bins2').agg(np.sum)

print('redshift bins=',zbins)
print('bin centers=', nz.index.categories.mid)
print('redshift bins2=',zbins2)
print('bin centers2=', nz2.index.categories.mid)
plt.step(nz.index.categories.mid,nz['wt'],where='mid',c='b',label='binc 0,0.1,...')
plt.step(nz2.index.categories.mid,nz2['wt'],where='mid',c='r',label='binc 0.5,0.15,...')
plt.xlabel('redshift')
plt.ylabel('Sum 1/tsr')
plt.title('SGC')
plt.legend()
zbins= [-0.05  0.05  0.15  0.25  0.35  0.45  0.55  0.65  0.75  0.85  0.95  1.05
  1.15  1.25  1.35  1.45  1.55  1.65  1.75  1.85  1.95  2.05]
redshift bins= [-0.05  0.05  0.15  0.25  0.35  0.45  0.55  0.65  0.75  0.85  0.95  1.05
  1.15  1.25  1.35  1.45  1.55  1.65  1.75  1.85  1.95  2.05]
bin centers= Float64Index([0.0, 0.1, 0.2, 0.3, 0.4, 0.5, 0.6, 0.7, 0.8, 0.9, 1.0, 1.1, 1.2,
              1.3, 1.4, 1.5, 1.6, 1.7, 1.8, 1.9, 2.0],
             dtype='float64')
redshift bins2= [ 0.   0.1  0.2  0.3  0.4  0.5  0.6  0.7  0.8  0.9  1.   1.1  1.2  1.3  1.4
  1.5  1.6  1.7  1.8  1.9  2. ]
bin centers2= Float64Index([0.05, 0.15, 0.25, 0.35, 0.45, 0.55, 0.65, 0.75, 0.85, 0.95, 1.05,
              1.15, 1.25, 1.35, 1.45, 1.55, 1.65, 1.75, 1.85, 1.95],
             dtype='float64')
Out[846]:
<matplotlib.legend.Legend at 0x12226a2b0>
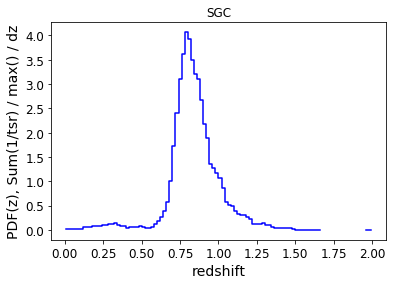
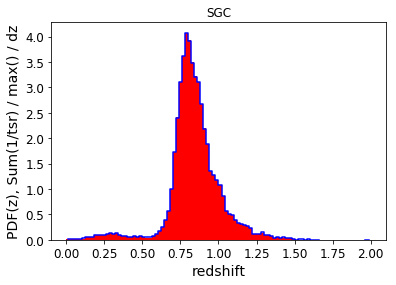
n(z) weighted by spectroscopic completness (1/TSR)
In [847]:
dz= 0.02
zbins= np.arange(0,2.+dz,dz)
df_z['bins']= pd.cut(df_z['redshift'],bins=zbins)
nz= df_z.loc[:,['wt','bins']].groupby('bins').agg(np.sum)
nz['wt']= nz['wt']/np.sum(nz['wt'])

print('redshift bins=',zbins)
print('bin centers=', nz.index.categories.mid)
plt.step(nz.index.categories.mid,nz['wt']/dz,where='mid',c='b')
plt.xlabel('redshift')
plt.ylabel('PDF(z), Sum(1/tsr) / max() / dz')
plt.title('SGC')

print('isNORMED?', np.sum(nz['wt']/dz) * dz)
redshift bins= [ 0.    0.02  0.04  0.06  0.08  0.1   0.12  0.14  0.16  0.18  0.2   0.22
  0.24  0.26  0.28  0.3   0.32  0.34  0.36  0.38  0.4   0.42  0.44  0.46
  0.48  0.5   0.52  0.54  0.56  0.58  0.6   0.62  0.64  0.66  0.68  0.7
  0.72  0.74  0.76  0.78  0.8   0.82  0.84  0.86  0.88  0.9   0.92  0.94
  0.96  0.98  1.    1.02  1.04  1.06  1.08  1.1   1.12  1.14  1.16  1.18
  1.2   1.22  1.24  1.26  1.28  1.3   1.32  1.34  1.36  1.38  1.4   1.42
  1.44  1.46  1.48  1.5   1.52  1.54  1.56  1.58  1.6   1.62  1.64  1.66
  1.68  1.7   1.72  1.74  1.76  1.78  1.8   1.82  1.84  1.86  1.88  1.9
  1.92  1.94  1.96  1.98  2.  ]
bin centers= Float64Index([0.01, 0.03, 0.05, 0.07, 0.09, 0.11, 0.13, 0.15, 0.17, 0.19, 0.21,
              0.23, 0.25, 0.27, 0.29, 0.31, 0.33, 0.35, 0.37, 0.39, 0.41, 0.43,
              0.45, 0.47, 0.49, 0.51, 0.53, 0.55, 0.57, 0.59, 0.61, 0.63, 0.65,
              0.67, 0.69, 0.71, 0.73, 0.75, 0.77, 0.79, 0.81, 0.83, 0.85, 0.87,
              0.89, 0.91, 0.93, 0.95, 0.97, 0.99, 1.01, 1.03, 1.05, 1.07, 1.09,
              1.11, 1.13, 1.15, 1.17, 1.19, 1.21, 1.23, 1.25, 1.27, 1.29, 1.31,
              1.33, 1.35, 1.37, 1.39, 1.41, 1.43, 1.45, 1.47, 1.49, 1.51, 1.53,
              1.55, 1.57, 1.59, 1.61, 1.63, 1.65, 1.67, 1.69, 1.71, 1.73, 1.75,
              1.77, 1.79, 1.81, 1.83, 1.85, 1.87, 1.89, 1.91, 1.93, 1.95, 1.97,
              1.99],
             dtype='float64')
isNORMED? 1.00000007629
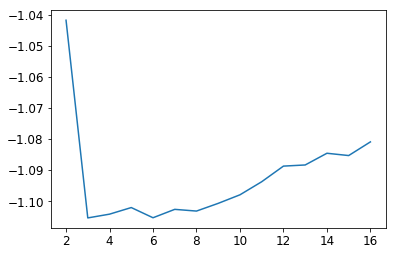
Gaussian Mixture for n(z)
In [849]:
gmms,i_min, n_comp, BICs= my_mixture(np.array(X).reshape(-1,1),
                                     n_comp=np.arange(2,17))
plt.plot(n_comp,BICs)
3 components
Out[849]:
[<matplotlib.lines.Line2D at 0x1222bd898>]
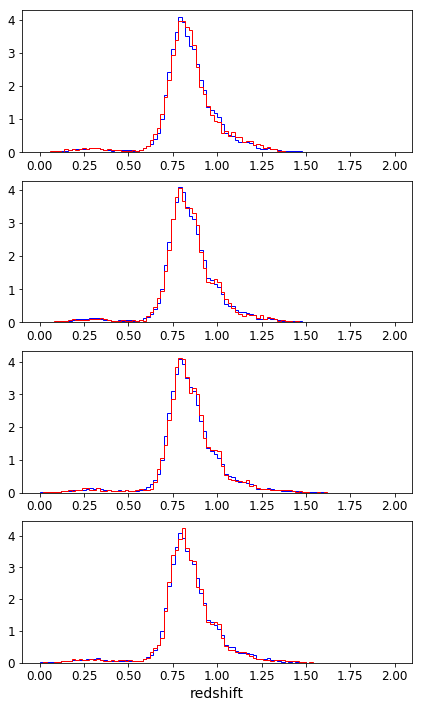
In [850]:
fig,ax= plt.subplots(4,1,figsize=(7,12))

for col,n in enumerate([3,6,8,10]):
    i= np.where(n_comp == n)[0][0]
    Xpred,Ypred= gmms[i].sample(10000)
    _=ax[col].hist(X,bins=zbins,histtype='step',color='b',normed=True)
    _=ax[col].hist(Xpred,bins=zbins,histtype='step',color='r',normed=True)

ax[-1].set_xlabel('redshift')
Out[850]:
<matplotlib.text.Text at 0x1222a8d30>
In [851]:
gmm= gmms[np.where(n_comp == 10)[0][0]]
z_pred,pdf_pred= gmm.sample(10000)
_=plt.hist(X,bins=zbins,histtype='step',color='b',normed=True)
_=plt.hist(Xpred,bins=zbins,histtype='step',color='r',normed=True)
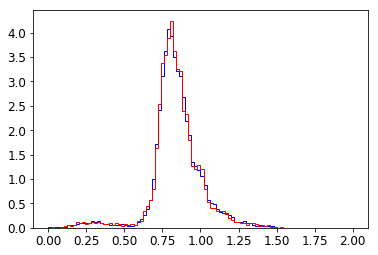
10 components reproduce true n(z)
In [848]:
nz_pdf= nz['wt'].values
redshifts= nz.index.categories.mid.values
X= []
for z,num in zip(redshifts, nz_pdf * 10000):
    if not np.isfinite(num):
        print('its nan',z,num)
        continue
    X += [z] * int(num)
# for z,num in zip(redshifts, nz_pdf * 10000):
#     print(z,int(num))
print(len(X),X[0])

plt.step(nz.index.categories.mid,nz['wt']/dz,where='mid',c='b',label='exact')
_=plt.hist(X,bins=zbins, normed=True,color='r',label='approx')
plt.xlabel('redshift')
plt.ylabel('PDF(z), Sum(1/tsr) / max() / dz')
plt.title('SGC')
its nan 1.67 nan
its nan 1.69 nan
its nan 1.71 nan
its nan 1.73 nan
its nan 1.75 nan
its nan 1.77 nan
its nan 1.79 nan
its nan 1.81 nan
its nan 1.83 nan
its nan 1.85 nan
its nan 1.87 nan
its nan 1.89 nan
its nan 1.91 nan
its nan 1.93 nan
its nan 1.95 nan
9958 0.01
Out[848]:
<matplotlib.text.Text at 0x122296908>
Save GM model
In [904]:
GaussianMixtureModel.save(gmm, filename='eboss_nz_elg')
Wrote eboss_nz_elg_means.txt
Wrote eboss_nz_elg_weights.txt
Wrote eboss_nz_elg_covars.txt
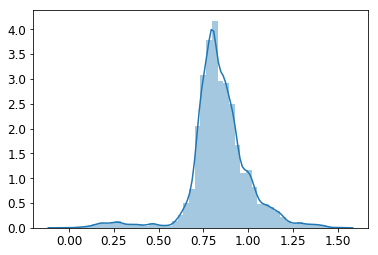
In [908]:
# Test load
gmm= GaussianMixtureModel.load('eboss_nz_elg',py='36',is1D=True)
redshifts= gmm.sample(10000)
len(redshifts)
sns.distplot(redshifts)
(10, 1)
Out[908]:
<matplotlib.axes._subplots.AxesSubplot at 0x137306c88>
Draw n(z) & Query KDTree for nearest redshift in sample
In [943]:
gmm= GaussianMixtureModel.load('eboss_nz_elg',py='36',is1D=True)
# These are in my google drive
dr3dp2_exp= pd.read_csv('eboss_elg_dr3deep2_EXP.csv')
dr3dp2_dev= pd.read_csv('eboss_elg_dr3deep2_DEV.csv')
eboss_exp= pd.read_csv('eboss_elg_tsspectra_EXP.csv')
eboss_dev= pd.read_csv('eboss_elg_tsspectra_DEV.csv')

dr3dp2_both= pd.concat([dr3dp2_exp,dr3dp2_dev],axis='rows')
assert(dr3dp2_both.shape[0] == dr3dp2_exp.shape[0] + dr3dp2_dev.shape[0])

from scipy import spatial
trees= dict(dr3dp2_exp= spatial.KDTree(dr3dp2_exp['redshift'].values.reshape(-1,1)),
            dr3dp2_dev= spatial.KDTree(dr3dp2_dev['redshift'].values.reshape(-1,1)),
            dr3dp2_both= spatial.KDTree(dr3dp2_both['redshift'].values.reshape(-1,1)),
            eboss_exp= spatial.KDTree(eboss_exp['redshift'].values.reshape(-1,1)),
            eboss_dev= spatial.KDTree(eboss_dev['redshift'].values.reshape(-1,1)))


def inEbossBox(rz,gr,pad=0.):
    sgc_d= EbossBox().SGC(rz,pad=pad)
    return ((gr > sgc_d['y1']) &
            (gr < sgc_d['y2']) &
            (gr < sgc_d['y3']) &
            (gr < sgc_d['y4']))

inBox=dict(dr3dp2_exp=inEbossBox(dr3dp2_exp['r'] - dr3dp2_exp['z'],
                                 dr3dp2_exp['g'] - dr3dp2_exp['r']),
           dr3dp2_dev=inEbossBox(dr3dp2_dev['r'] - dr3dp2_dev['z'],
                                 dr3dp2_dev['g'] - dr3dp2_dev['r']))
In [977]:
T= fits_table()
# Draw z from n(z), if z not in [0,2] redraw, store z
redshifts= gmm.sample(10000).reshape(-1)

def outside_lims(z):
    red_lims=[0.,2.]
    return ((z < red_lims[0]) |
            (z > red_lims[1]))

i=0
redraw= outside_lims(redshifts)
num= len(redshifts[redraw])
while num > 0:
    i+=1
    if i > 20:
        raise ValueError
    print('redrawing %d redshifts' % num)
    redshifts[redraw]= gmm.sample(num).reshape(-1)
    redraw= outside_lims(redshifts)
    num= len(redshifts[redraw])
# Store
T.set('redshift',redshifts)

# flip coin, 90% assign type = EXP, 10% assign type = DEV, store type
types= np.array(['EXP']*9 + ['DEV'])
T.set('type',types[np.random.randint(0,len(types),size=len(T))])

# in eboss TS box
# in dr3_deep2 exp+dev combined sample, find NN redshift
print('len T=',len(T))
_,i_both= trees['dr3dp2_both'].query(T.redshift.reshape(-1,1))
print('len i_both=',len(i_both))
inBox['dr3dp2_both']= inEbossBox(dr3dp2_both['r'].iloc[i_both] - dr3dp2_both['z'].iloc[i_both],
                                 dr3dp2_both['g'].iloc[i_both] - dr3dp2_both['r'].iloc[i_both])
print('len inBox=',len(inBox['dr3dp2_both']))

# Assign g,r,z,rhalf for NNs + unique id + NN redshift to see how close really is...
d= {}
mag_shapes= ['g','r','z','fwhm_or_rhalf']
for col in mag_shapes:
    d[col]= np.zeros(len(T))-1
d['nn_redshift']= np.zeros(len(T))-1
d['id']= np.zeros(len(T)).astype(str)

# inBox, use eBOSS data
keep= (inBox['dr3dp2_both']) & (T.type == 'EXP')
_,i_df= trees['eboss_exp'].query(T.redshift[keep].reshape(-1,1))
for col in mag_shapes:
    d[col][keep]= eboss_exp[col].iloc[i_df]
d['id'][keep]= eboss_exp['sdss_id'].iloc[i_df]
d['nn_redshift'][keep]= eboss_exp['redshift'].iloc[i_df]

keep= (inBox['dr3dp2_both']) & (T.type == 'DEV')
_,i_df= trees['eboss_dev'].query(T.redshift[keep].reshape(-1,1))
for col in mag_shapes:
    d[col][keep]= eboss_dev[col].iloc[i_df]
d['id'][keep]= eboss_dev['sdss_id'].iloc[i_df]
d['nn_redshift'][keep]= eboss_dev['redshift'].iloc[i_df]

# outBox, use DR3-Deep2 data
keep= (~inBox['dr3dp2_both']) & (T.type == 'EXP')
_,i_df= trees['dr3dp2_exp'].query(T.redshift[keep].reshape(-1,1))
for col in mag_shapes:
    d[col][keep]= dr3dp2_exp[col].iloc[i_df]
d['id'][keep]= dr3dp2_exp['tractor_id'].iloc[i_df]
d['nn_redshift'][keep]= dr3dp2_exp['redshift'].iloc[i_df]

keep= (~inBox['dr3dp2_both']) & (T.type == 'DEV')
_,i_df= trees['dr3dp2_dev'].query(T.redshift[keep].reshape(-1,1))
for col in mag_shapes:
    d[col][keep]= dr3dp2_dev[col].iloc[i_df]
d['id'][keep]= dr3dp2_dev['tractor_id'].iloc[i_df]
d['nn_redshift'][keep]= dr3dp2_dev['redshift'].iloc[i_df]

# Add sersic n
d['n']= np.zeros(len(T)) - 1
d['n'][T.type == 'EXP']= 1
d['n'][T.type == 'DEV']= 4

for col in mag_shapes + ['nn_redshift','n']:
    assert(np.all(d[col] > 0))
assert(np.all(pd.Series(d['id']).str.len() > 1))

for col in mag_shapes + ['nn_redshift','n']:
    T.set(col,d[col])
T.set('id',d['id'])
T.delete_column('type')
(10,)
len T= 10000
len i_both= 10000
len inBox= 10000
In [978]:
T.get_columns()
Out[978]:
['redshift', 'g', 'r', 'z', 'fwhm_or_rhalf', 'nn_redshift', 'n', 'id']
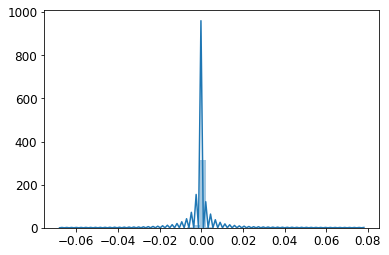
Nearest redshifts are nearly all within ~ 0.02
In [979]:
sns.distplot(T.nn_redshift - T.redshift)
pd.Series(T.nn_redshift - T.redshift).describe()
Out[979]:
count    1.000000e+04
mean     6.410920e-06
std      4.001393e-03
min     -6.803535e-02
25%     -1.384403e-05
50%      1.198784e-07
75%      2.445551e-05
max      7.804136e-02
dtype: float64
Correct fraction of DEV ~ 10%
In [980]:
pd.Series(T.n).value_counts()
Out[980]:
1.0    8937
4.0    1063
dtype: int64
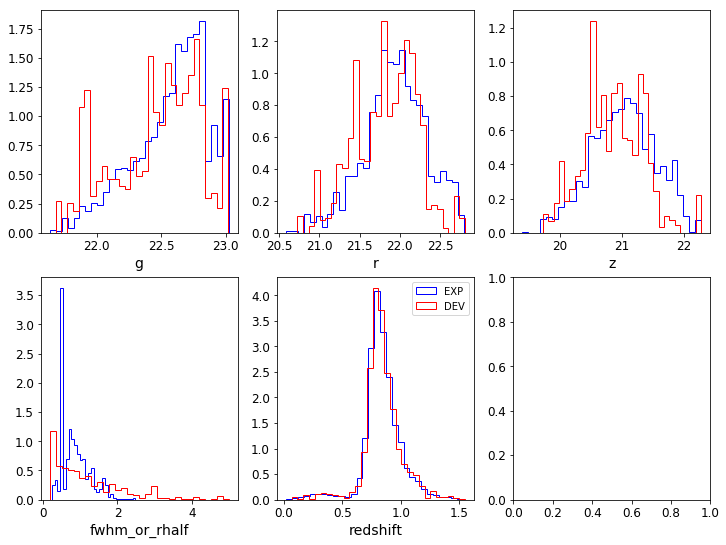
EXP/DEV have correct color, shape, size AND eBOSS n(z)
In [983]:
cols= mag_shapes + ['redshift']

fig,ax= plt.subplots(2,3,figsize=(12,9))
i=-1
for row in range(2):
    for col in range(3):
        i+=1
        if i >= len(cols):
            continue
        _=ax[row,col].hist(T.get(cols[i])[T.n == 1],
                           histtype='step',normed=True,
                           bins=30,color='b',label='EXP')
        _=ax[row,col].hist(T.get(cols[i])[T.n == 4.],
                           histtype='step',normed=True,
                           bins=30,color='r',label='DEV')
        ax[row,col].set_xlabel(cols[i])
ax[1,1].legend()
Out[983]:
<matplotlib.legend.Legend at 0x1aede3780>
In [206]:
ccd_coadd= fits_table(os.path.join(os.environ['HOME'],'Downloads',
                         'ebossDR3','legacysurvey-3583p000-ccds.fits'))
#dr3_ccds= fits_table(os.path.join(os.environ['HOME'],'Downloads',
#                         'ebossDR3','survey-ccds-decals.fits.gz'))
#dr3_ccds= fits_table(os.path.join(os.environ['HOME'],'Downloads',
#                         'ebossDR3','survey-ccds-extra.fits.gz'))
dr3_ccds= fits_table(os.path.join(os.environ['HOME'],'Downloads',
                         'ebossDR3','survey-ccds-nondecals.fits.gz'))
Converted object from |S37 to <U37
Converted filter from |S1 to <U1
Converted date_obs from |S10 to <U10
Converted ut from |S15 to <U15
Converted ha from |S13 to <U13
Converted propid from |S10 to <U10
Converted ccdname from |S3 to <U3
Converted camera from |S5 to <U5
Converted expid from |S12 to <U12
Converted image_filename from |S61 to <U61
Converted plver from |S4 to <U4
Converted skyver from |S16 to <U16
Converted wcsver from |S1 to <U1
Converted psfver from |S12 to <U12
Converted skyplver from |S4 to <U4
Converted wcsplver from |S4 to <U4
Converted psfplver from |S4 to <U4
Converted object from |S35 to <U35
Converted filter from |S1 to <U1
Converted date_obs from |S10 to <U10
Converted ut from |S15 to <U15
Converted ha from |S13 to <U13
Converted propid from |S10 to <U10
Converted ccdname from |S3 to <U3
Converted camera from |S5 to <U5
Converted expid from |S12 to <U12
Converted image_filename from |S61 to <U61
In [207]:
print(len(ccd_coadd.get_columns()), len(dr3_ccds.get_columns()))
same_cols= set(ccd_coadd.get_columns()).intersection(set(dr3_ccds.get_columns()))
print(len(same_cols))
70 52
52
In [208]:
print(ccd_coadd.ccdname[0],ccd_coadd.image_filename[0],ccd_coadd.date_obs[0])
print(dr3_ccds.ccdname[0],dr3_ccds.image_filename[0])
S25 decam/CPDES82/c4d_130902_061728_ooi_g_v1.fits.fz              2013-09-02
S29 decam/NonDECaLS/CP20130129/c4d_130130_004145_ooi_r_v1.fits.fz
In [209]:
i= ((pd.Series(dr3_ccds.ccdname).str.strip() == 'S25') &
    (pd.Series(dr3_ccds.image_filename).str.strip() == \
               'decam/CPDES82/c4d_130902_061728_ooi_g_v1.fits.fz'))
In [210]:
dr3_ccds[i]
Out[210]:
<tabledata object with 1 rows and 52 columns: object=DES survey hex -12-14 tiling 4 , expnum=229686, exptime=90.0, filter=g, seeing=1.72676, date_obs=2013-09-02, mjd_obs=56537.2621324, ut=06:17:28.238325, ha=00:24:18.570 , airmass=1.16, propid=2012B-0001, zpt=25.2166, avsky=124.355, arawgain=4.6, fwhm=7.44643, crpix1=11167.8, crpix2=8436.0, crval1=358.871992422, crval2=-0.635496023898, cd1_1=-7.99839e-08, cd1_2=7.28623e-05, cd2_1=-7.28599e-05, cd2_2=-8.01916e-08, ccdnum=4, ccdname=S25, ccdzpt=25.2163, ccdzpta=25.2169, ccdzptb=25.2181, ccdphoff=0.263215, ccdphrms=0.0156626, ccdskyrms=6.17303, ccdskymag=21.6912, ccdskycounts=124.622, ccdraoff=-0.0104072, ccddecoff=-0.015203, ccdtransp=1.30667, ccdnstar=72, ccdnmatch=52, ccdnmatcha=30, ccdnmatchb=22, ccdmdncol=1.63293, temp=10.1, camera=decam, expid=00229686-S25, image_hdu=4, image_filename=decam/CPDES82/c4d_130902_061728_ooi_g_v1.fits.fz , width=2046, height=4094, ra_bore=358.871992422, dec_bore=-0.635496023898, ra=358.407016199, dec=0.104954658094>
In [212]:
for col in list(same_cols):
    print(ccd_coadd.get(col)[0],dr3_ccds[i].get(col)[0])
229686 229686
124.622 124.622
-7.99839e-08 -7.99839e-08
22 22
-0.0104072 -0.0104072
decam decam
DES survey hex -12-14 tiling 4        DES survey hex -12-14 tiling 4
00229686-S25 00229686-S25
25.2166 25.2166
7.44643 7.44643
g g
2012B-0001 2012B-0001
-8.01916e-08 -8.01916e-08
25.2169 25.2169
-0.635496023898 -0.635496023898
2046 2046
S25 S25
358.407016199 358.407016199
-0.635496023898 -0.635496023898
52 52
1.16 1.16
72 72
90.0 90.0
4 4
358.871992422 358.871992422
1.63293 1.63293
0.0156626 0.0156626
21.6912 21.6912
11167.8 11167.8
10.1 10.1
6.17303 6.17303
00:24:18.570  00:24:18.570
56537.2621324 56537.2621324
8436.0 8436.0
06:17:28.238325 06:17:28.238325
25.2181 25.2181
0.263215 0.263215
4 4
4.6 4.6
decam/CPDES82/c4d_130902_061728_ooi_g_v1.fits.fz              decam/CPDES82/c4d_130902_061728_ooi_g_v1.fits.fz
30 30
4094 4094
2013-09-02 2013-09-02
-7.28599e-05 -7.28599e-05
7.28623e-05 7.28623e-05
1.72676 1.72676
124.355 124.355
1.30667 1.30667
-0.015203 -0.015203
25.2163 25.2163
0.104954658094 0.104954658094
358.871992422 358.871992422
In [213]:
allccds= [fits_table(os.path.join(os.environ['HOME'],'Downloads',
                            'ebossDR3','survey-ccds-%s.fits.gz' % name))
          for name in ['decals','extra','nondecals']]
allccds= merge_tables(allccds, columns='fillzero')
Converted object from |S35 to <U35
Converted filter from |S1 to <U1
Converted date_obs from |S10 to <U10
Converted ut from |S15 to <U15
Converted ha from |S13 to <U13
Converted propid from |S10 to <U10
Converted ccdname from |S3 to <U3
Converted camera from |S5 to <U5
Converted expid from |S12 to <U12
Converted image_filename from |S61 to <U61
Converted object from |S37 to <U37
Converted filter from |S1 to <U1
Converted date_obs from |S10 to <U10
Converted ut from |S15 to <U15
Converted ha from |S13 to <U13
Converted propid from |S10 to <U10
Converted ccdname from |S3 to <U3
Converted camera from |S5 to <U5
Converted expid from |S12 to <U12
Converted image_filename from |S61 to <U61
Converted object from |S35 to <U35
Converted filter from |S1 to <U1
Converted date_obs from |S10 to <U10
Converted ut from |S15 to <U15
Converted ha from |S13 to <U13
Converted propid from |S10 to <U10
Converted ccdname from |S3 to <U3
Converted camera from |S5 to <U5
Converted expid from |S12 to <U12
Converted image_filename from |S61 to <U61
In [230]:
expids= pd.Series(.expid).str.split('-').str[0].values
ccdnames= pd.Series(dr3_ccds.ccdname).str.strip().values
Out[230]:
7944
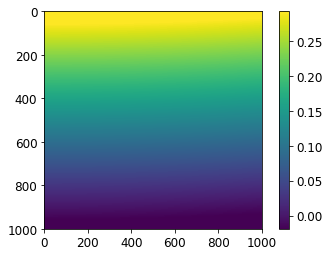
In [143]:
def nstars(l, b):
    """Rongpu Zhou's model
    https://desi.lbl.gov/DocDB/cgi-bin/private/RetrieveFile?docid=2966
    """
    c1, c2, c3 =  [0.56099869, 0.08483852,  0.428828]
    return (1/np.sin(np.abs(b)/180*np.pi)-1) * \
            (1+c1*np.cos(l/180*np.pi)+c2*np.cos(2*l/180*np.pi))+c3


xv, yv = np.meshgrid(np.linspace(-180,180,1000),np.linspace(-80,80,1000))
n= nstars(xv,yv)
n.shape
Out[143]:
(1000, 1000)
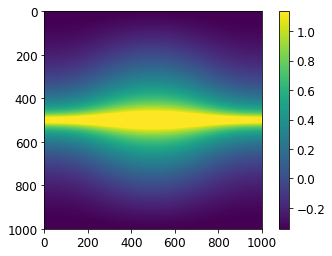
In [155]:
xv, yv = np.meshgrid(np.linspace(0,20,1000),np.linspace(30,50,1000))
n= nstars(xv,yv)
print(np.median(n))

vmin,vmax= np.percentile(n,q=5),np.percentile(n,q=95)
plt.imshow(np.log10(n),vmin=np.log10(vmin),vmax=np.log10(vmax))
plt.colorbar()
1.33336159055
Out[155]:
<matplotlib.colorbar.Colorbar at 0x119064b70>
In [149]:
vmin,vmax= np.percentile(n,q=5),np.percentile(n,q=95)
fig,ax= plt.subplots(1,2,figsize=(10,5))
ax[0].imshow(n,vmin=vmin,vmax=vmax)
plt.colorbar(ax=ax[0])

ax[1].imshow(np.log10(n),vmin=np.log10(vmin),vmax=np.log10(vmax))
ax[1].colorbar()
---------------------------------------------------------------------------
RuntimeError                              Traceback (most recent call last)
<ipython-input-149-988af8044db7> in <module>()
      2 fig,ax= plt.subplots(1,2,figsize=(10,5))
      3 ax[0].imshow(n,vmin=vmin,vmax=vmax)
----> 4 plt.colorbar(ax=ax[0])
      5
      6 ax[1].imshow(np.log10(n),vmin=np.log10(vmin),vmax=np.log10(vmax))

~/miniconda3/envs/mlbook/lib/python3.6/site-packages/matplotlib/pyplot.py in colorbar(mappable, cax, ax, **kw)
   2252         mappable = gci()
   2253         if mappable is None:
-> 2254             raise RuntimeError('No mappable was found to use for colorbar '
   2255                                'creation. First define a mappable such as '
   2256                                'an image (with imshow) or a contour set ('

RuntimeError: No mappable was found to use for colorbar creation. First define a mappable such as an image (with imshow) or a contour set (with contourf).
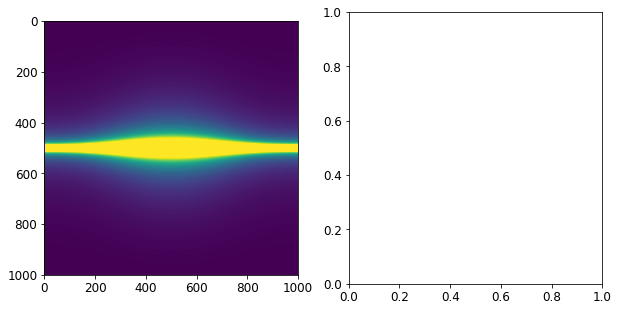
In [150]:
vmin,vmax= np.percentile(n,q=5),np.percentile(n,q=95)
plt.imshow(n,vmin=vmin,vmax=vmax)
plt.colorbar()
Out[150]:
<matplotlib.colorbar.Colorbar at 0x1193c27b8>
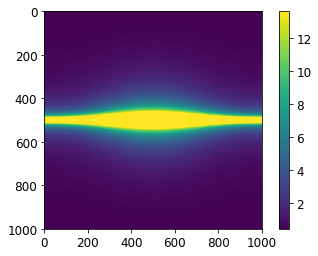
In [151]:
plt.imshow(np.log10(n),vmin=np.log10(vmin),vmax=np.log10(vmax))
plt.colorbar()
Out[151]:
<matplotlib.colorbar.Colorbar at 0x119778320>
In [146]:
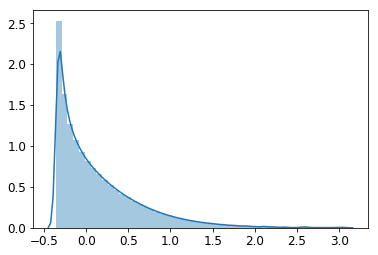
sns.distplot(np.log10(n.flatten()))
#plt.xlim(-1,1)
print(n.min(),n.max())
0.436909073748 1176.345523
In [ ]:
#sns.distplot(np.log10(n.flatten()))
DESI
Use DR5 data
In [583]:
DATA_DIR = os.path.join(os.environ['HOME'],'Downloads',
                        'truth')
dr5_fns= glob(os.path.join(DATA_DIR,
                'dr5.0/trimmed/decals-dr5.0-deep2-field*-trim.fits'))
dp2_fns= glob(os.path.join(DATA_DIR,
                'dr5.0/trimmed/deep2-field*-trim.fits'))
print(dr5_fns,dp2_fns)

dr5= stack_tables(dr5_fns)
dp2= stack_tables(dp2_fns)
['/Users/kaylan1/Downloads/truth/dr5.0/trimmed/decals-dr5.0-deep2-field2-trim.fits', '/Users/kaylan1/Downloads/truth/dr5.0/trimmed/decals-dr5.0-deep2-field3-trim.fits', '/Users/kaylan1/Downloads/truth/dr5.0/trimmed/decals-dr5.0-deep2-field4-trim.fits'] ['/Users/kaylan1/Downloads/truth/dr5.0/trimmed/deep2-field2-trim.fits', '/Users/kaylan1/Downloads/truth/dr5.0/trimmed/deep2-field3-trim.fits', '/Users/kaylan1/Downloads/truth/dr5.0/trimmed/deep2-field4-trim.fits']
Stacking /Users/kaylan1/Downloads/truth/dr5.0/trimmed/decals-dr5.0-deep2-field2-trim.fits
Converted brickname from |S8 to <U8
Converted type from |S4 to <U4
Converted wise_coadd_id from |S8 to <U8
Stacking /Users/kaylan1/Downloads/truth/dr5.0/trimmed/decals-dr5.0-deep2-field3-trim.fits
Converted brickname from |S8 to <U8
Converted type from |S4 to <U4
Converted wise_coadd_id from |S8 to <U8
Stacking /Users/kaylan1/Downloads/truth/dr5.0/trimmed/decals-dr5.0-deep2-field4-trim.fits
Converted brickname from |S8 to <U8
Converted type from |S4 to <U4
Converted wise_coadd_id from |S8 to <U8
Stacking /Users/kaylan1/Downloads/truth/dr5.0/trimmed/deep2-field2-trim.fits
Converted source from |S12 to <U12
Converted vis_morph from |S1 to <U1
Stacking /Users/kaylan1/Downloads/truth/dr5.0/trimmed/deep2-field3-trim.fits
Converted source from |S12 to <U12
Converted vis_morph from |S1 to <U1
Stacking /Users/kaylan1/Downloads/truth/dr5.0/trimmed/deep2-field4-trim.fits
Converted source from |S12 to <U12
Converted vis_morph from |S1 to <U1
In [584]:
def get_xy_pad(slope,pad):
    """Returns dx,dy"""
    theta= np.arctan(abs(slope))
    return pad*np.sin(theta), pad*np.cos(theta)

def y1_line(rz,pad=None):
    slope,yint= 1.15,-0.15
    if pad:
        dx,dy= get_xy_pad(slope,pad)
        return slope*(rz+dx) + yint + dy
    else:
        return slope*rz + yint

def y2_line(rz,pad=None):
    slope,yint= -1.2,1.6
    if pad:
        dx,dy= get_xy_pad(slope,pad)
        return slope*(rz-dx) + yint + dy
    else:
        return slope*rz + yint

def get_ELG_box(rz,gr, pad=None):
    """
    Args:
        rz: r-z
        gr: g-r
        pad: magnitudes of padding to expand TS box
    """
    x1,y1= rz,y1_line(rz)
    x2,y2= rz,y2_line(rz)
    x3,y3= np.array([0.3]*len(rz)),gr
    x4,y4= np.array([1.6]*len(rz)),gr
    if pad:
        dx,dy= get_xy_pad(1.15,pad)
        x1,y1= x1-dx,y1+dy
        dx,dy= get_xy_pad(-1.2,pad)
        x2,y2= x2+dx,y2+dy
        x3 -= pad
        x4 += pad
    return dict(x1=x1, y1=y1,
                x2=x2, y2=y2,
                x3=x3, y3=y3,
                x4=x4, y4=y4)
In [585]:
grz_gt0= ((dr5.flux_g > 0) &
          (dr5.flux_r > 0) &
          (dr5.flux_z > 0) &
          (dr5.flux_ivar_g > 0) &
          (dr5.flux_ivar_r > 0) &
          (dr5.flux_ivar_z > 0))
#redshift_gt0= dp2.zhelio > 0
complDP2_buff= ((dp2.zhelio >= 0.8-0.2) &
                (dp2.zhelio <= 1.4+0.2))

fwhm_or_rhalf= np.zeros(len(dr5))-1 # arcsec
isPSF= np.char.strip(dr5.type) == 'PSF'
isEXP= pd.Series(np.char.strip(dr5.type)).isin(['EXP','REX'])
isSIMP= np.char.strip(dr5.type) == 'SIMP'
isDEV= np.char.strip(dr5.type) == 'DEV'
isCOMP= np.char.strip(dr5.type) == 'COMP'
# rhalf ~ fwhm/2
fwhm_or_rhalf[isPSF]= np.mean(np.array([dr5[isPSF].psfsize_g,
                                        dr5[isPSF].psfsize_r,
                                        dr5[isPSF].psfsize_z]),axis=0)/2
fwhm_or_rhalf[isSIMP]= 0.5
fwhm_or_rhalf[isEXP]= dr5[isEXP].shapeexp_r
fwhm_or_rhalf[isDEV]= dr5[isDEV].shapedev_r
dr5.set('fwhm_or_rhalf',fwhm_or_rhalf)

print(len(dr5),len(dp2))
print(len(dr5[grz_gt0]), len(dr5[isDEV]), len(dr5[isCOMP]))
print(len(dr5[fwhm_or_rhalf < 5]),len(dr5[complDP2_buff]))

print(set(dr5.type))
print(pd.Series(dr5.type).value_counts()/len(dr5))
28300 28300
27707 769 78
28283 23211
{'EXP', 'COMP', 'DEV', 'PSF', 'REX'}
REX     0.506325
PSF     0.324912
EXP     0.138834
DEV     0.027173
COMP    0.002756
dtype: float64
In [586]:
keep= ((grz_gt0) &
       (isCOMP == False) &
       (fwhm_or_rhalf < 5) &
       (complDP2_buff))
dr5.cut(keep)
dp2.cut(keep)
len(dr5)
Out[586]:
22705
In [587]:
d= {}
for i,b in zip([1,2,4],'grz'):
    d[b]= flux2mag(dr5.get('flux_'+b)/dr5.get('mw_transmission_'+b))
    #d[b+'_ivar']= flux2mag(dr5.get('decam_flux_ivar')[:,i]/dr5.get('decam_mw_transmission')[:,i])
d['redshift']= dp2.get('zhelio')
d['fwhm_or_rhalf']= dr5.fwhm_or_rhalf
d['type']= dr5.get('type')
df= pd.DataFrame(d)
df['g-r']= df['g'] - df['r']
df['r-z']= df['r'] - df['z']

# TS box
pad= get_ELG_box(df['r-z'].values,df['g-r'].values,pad=0.5)
inBox= ((df['g-r'] <= y1_line(df['r-z'],pad=0.5)) &
        (df['g-r'] <= y2_line(df['r-z'],pad=0.5)) &
        (df['r-z'] >= 0.3 - 0.5) &
        (df['r-z'] <= 1.6 + 0.5))

# separate out DEV, important galaxy type but in minority for Deep 2
isDEV= df['type'] == 'DEV'
print(df.loc[isDEV,'type'].value_counts())
print(df.loc[isDEV == False,'type'].value_counts())
DEV    654
Name: type, dtype: int64
REX    12046
PSF     6621
EXP     3384
Name: type, dtype: int64
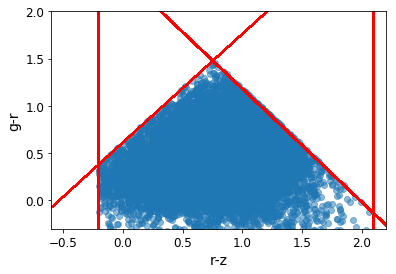
in TS box
In [588]:
fig,ax=plt.subplots()
ax.scatter(df.loc[inBox,'r-z'], df.loc[inBox,'g-r'],alpha=0.5)
ax.plot(pad['x1'],pad['y1'],'r--')
ax.plot(pad['x2'],pad['y2'],c='r',ls='--',lw=2)
ax.plot(pad['x3'],pad['y3'],c='r',ls='--',lw=2)
ax.plot(pad['x4'],pad['y4'],c='r',ls='--',lw=2)
ax.set_xlabel('r-z')
ax.set_ylabel('g-r')
ax.set_ylim(-0.3,2)
ax.set_xlim(-0.6,2.2)
Out[588]:
(-0.6, 2.2)
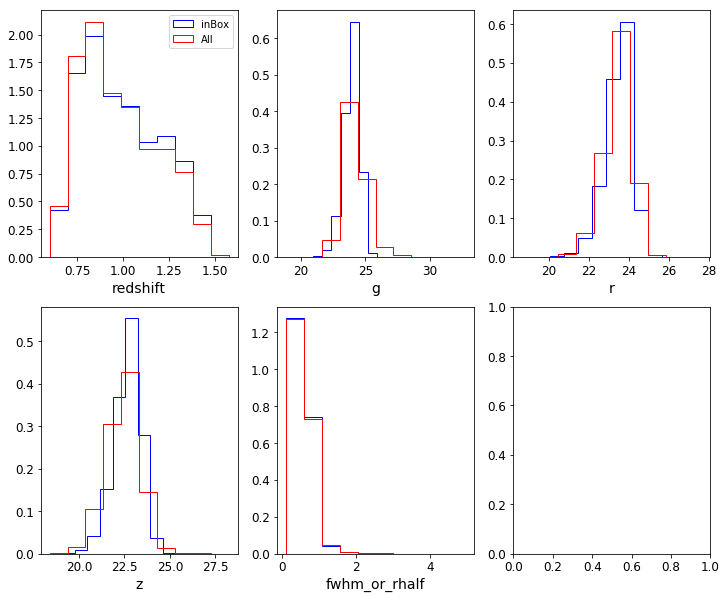
Properties != func(TS box)
In [112]:
attrs= ['redshift','g','r','z','fwhm_or_rhalf']

fig,ax= plt.subplots(2,3,figsize=(12,10))
i=-1
for row in range(2):
    for col in range(3):
        i+=1
        if i >= len(attrs):
            continue
        _=ax[row,col].hist(df.loc[inBox,attrs[i]],histtype='step',normed=True,
                           color='b',label='inBox')
        _=ax[row,col].hist(df[attrs[i]],histtype='step',normed=True,
                           color='r',label='All')
        ax[row,col].set_xlabel(attrs[i])
        if i == 0:
            ax[row,col].legend()
DEV are larger and brighter than EXP
In [113]:
attrs= ['redshift','g','r','z','fwhm_or_rhalf']

fig,ax= plt.subplots(2,3,figsize=(12,10))
i=-1
for row in range(2):
    for col in range(3):
        i+=1
        if i >= len(attrs):
            continue
        _=ax[row,col].hist(df.loc[(inBox) & (isDEV),attrs[i]],histtype='step',normed=True,
                           color='b',label='inBox, isDEV')
        _=ax[row,col].hist(df.loc[(inBox) & (~isDEV),attrs[i]],histtype='step',normed=True,
                           color='r',label='inBox, notDEV')
        ax[row,col].set_xlabel(attrs[i])
        if i == 0:
            ax[row,col].legend()
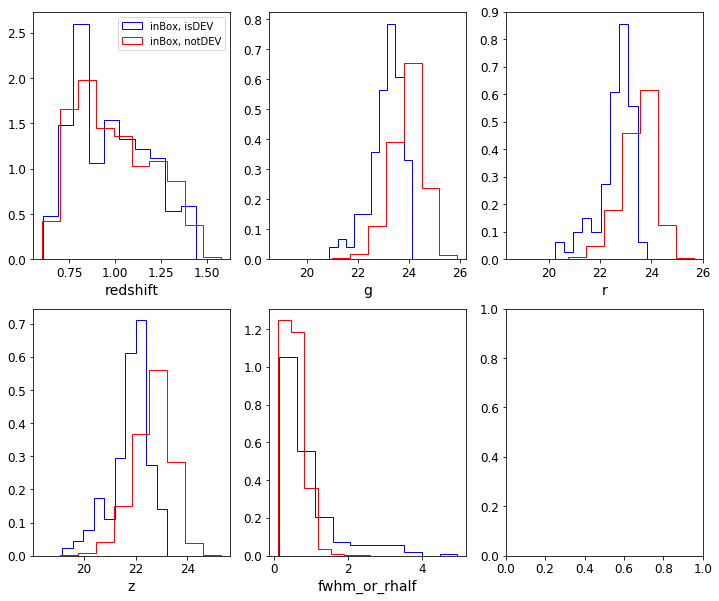
In [160]:
fit_cols= ['fwhm_or_rhalf', 'g-r', 'r-z','z','redshift']
df_dev= df.loc[(inBox) & (isDEV),fit_cols]
df_notdev= df.loc[(inBox) & (~isDEV),fit_cols]
# Carry on with NOT DEV
df_notdev.hist(bins=20,figsize=(12,8))
Out[160]:
array([[<matplotlib.axes._subplots.AxesSubplot object at 0x128365a58>,
        <matplotlib.axes._subplots.AxesSubplot object at 0x1240ee898>],
       [<matplotlib.axes._subplots.AxesSubplot object at 0x123cf5eb8>,
        <matplotlib.axes._subplots.AxesSubplot object at 0x11d172780>],
       [<matplotlib.axes._subplots.AxesSubplot object at 0x126857f28>,
        <matplotlib.axes._subplots.AxesSubplot object at 0x126857f60>]], dtype=object)
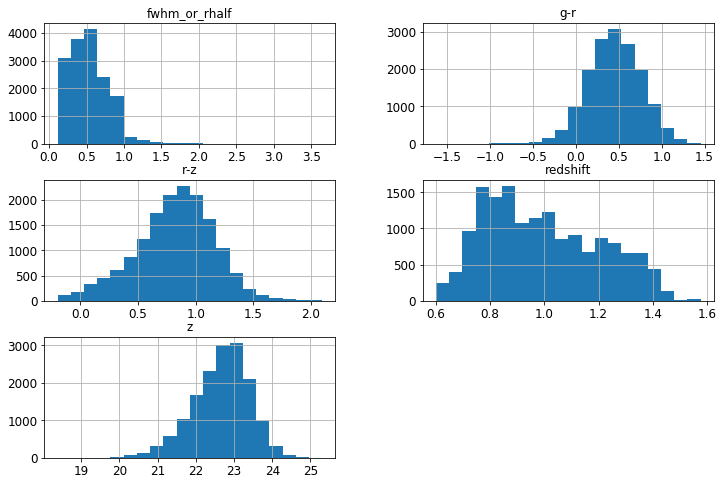
Model as Gaussian Mixture
Fit model
In [115]:
X= df_notdev.values
gmms,i_min, n_comp, BICs= my_mixture(X)
plt.plot(n_comp,BICs)
14 components
Out[115]:
[<matplotlib.lines.Line2D at 0x120a4b550>]
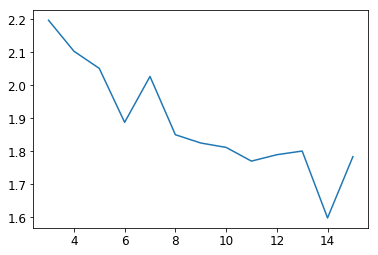
Minimum components for good model is 8 (don’t want to overfit)
In [120]:
fig,ax= plt.subplots(3,2,figsize=(13,5))

for row,n in enumerate([8,10,12]):
    i= np.where(n_comp == n)[0][0]
    Xpred,Ypred= gmms[i].sample(10000)
    _,bins,_= ax[row,0].hist(df_notdev['redshift'],bins=20,histtype='step',color='k',normed=True)
    _=ax[row,0].hist(Xpred[:,-1],bins=20,histtype='step',color='b',normed=True)
    #ax[1].set_xlabel('redshift')

    _,bins,_= ax[row,1].hist(df_notdev['fwhm_or_rhalf'],bins=20,histtype='step',color='k',normed=True)
    _=ax[row,1].hist(Xpred[:,0],bins=20,histtype='step',color='b',normed=True)
    #ax[2].set_xlabel('fwhm_or_rhalf')

ax[2,0].set_xlabel('redshift')
ax[2,1].set_xlabel('fwhm_or_rhalf')
Out[120]:
<matplotlib.text.Text at 0x121b18710>
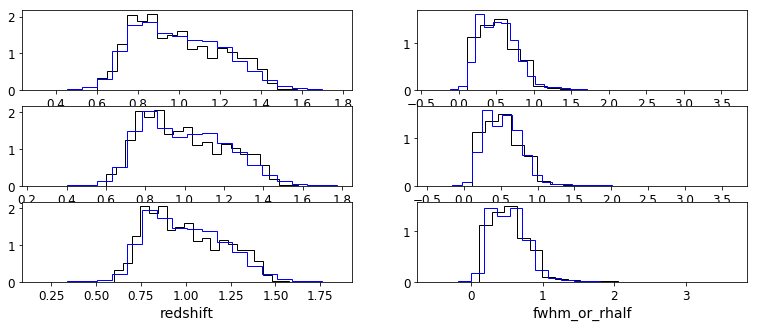
In [121]:
fig,ax= plt.subplots(3,3,figsize=(16,5))

for row,n in enumerate([8,10,12]):
    i= np.where(n_comp == n)[0][0]
    Xpred,Ypred= gmms[i].sample(10000)
    _,bins,_= ax[row,0].hist(df_notdev['z'],bins=20,histtype='step',color='k',normed=True)
    _=ax[row,0].hist(Xpred[:,-2],bins=20,histtype='step',color='b',normed=True)

    _,bins,_= ax[row,1].hist(df_notdev['r-z']+df_notdev['z'],bins=20,histtype='step',color='k',normed=True)
    _=ax[row,1].hist(Xpred[:,-3]+Xpred[:,-2],bins=20,histtype='step',color='b',normed=True)

    _,bins,_= ax[row,2].hist(df_notdev['g-r'] + df_notdev['r-z']+df_notdev['z'],bins=20,histtype='step',color='k',normed=True)
    _=ax[row,2].hist(Xpred[:,-4] + Xpred[:,-3] + Xpred[:,-2],bins=20,histtype='step',color='b',normed=True)

ax[2,0].set_xlabel('z')
ax[2,1].set_xlabel('r')
ax[2,2].set_xlabel('g')
Out[121]:
<matplotlib.text.Text at 0x121f69d68>
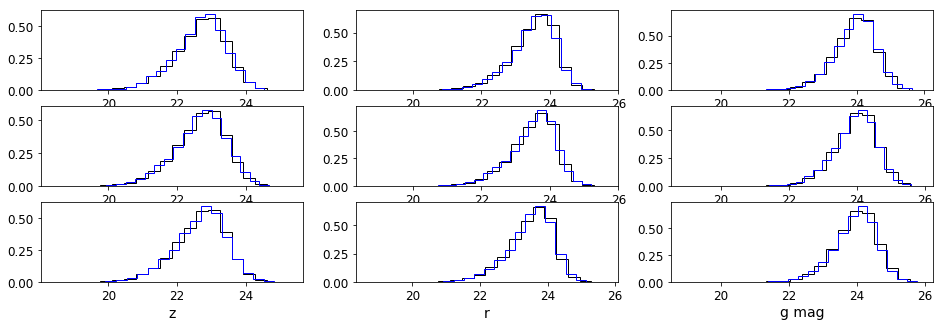
In [117]:
# smallest n_comp feel is ok, don't overfit!
gmm= gmms[np.where(n_comp == 8)[0][0]]
logprob= gmm.score_samples(X)
responsibilities = gmm.predict_proba(X)

Xpred,Ypred= gmm.sample(10000)
d={}
for i,col in enumerate(fit_cols):
    d[col]= Xpred[:,i]
df_pred= pd.DataFrame(d)
Model in TS region
In [77]:
fig,ax= plt.subplots(1,2,figsize=(10,5))
ax[0].scatter(df_notdev['r-z'],df_notdev['g-r'],color='b',alpha=0.05)
ax[1].scatter(df_pred['r-z'],df_pred['g-r'],color='r',alpha=0.05)
for i in range(2):
    ax[i].set_xlabel('r-z')
    ax[i].set_xlim(-0.5,2.5)
    ax[i].set_ylim(-1,2)
ax[0].set_ylabel('g-r')
Out[77]:
<matplotlib.text.Text at 0x11c6a6e80>
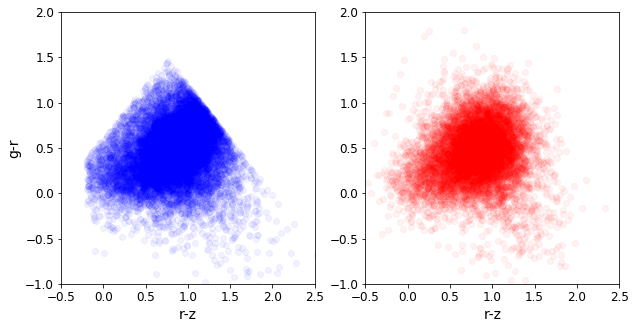
In [79]:
fig,ax= plt.subplots(1,2,figsize=(10,5))
ax[0].scatter(df_new['z'],df_notdev['fwhm_or_rhalf'],color='b',alpha=0.05)
ax[1].scatter(df_pred['z'],df_pred['fwhm_or_rhalf'],color='r',alpha=0.05)
for i in range(2):
    ax[i].set_xlabel('z mag')
ax[0].set_ylabel('fwhm_or_rhalf')
for i in range(2):
    ax[i].set_xlim(19,26)
    ax[i].set_ylim(-1,4.5)
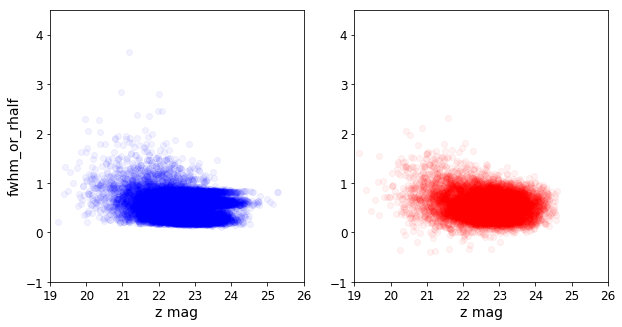
Redshift correlations
In [80]:
fig,ax= plt.subplots(1,2,figsize=(10,5))
ax[0].scatter(df_notdev['z'],df_notdev['redshift'],color='b',alpha=0.05)
ax[1].scatter(df_pred['z'],df_pred['redshift'],color='r',alpha=0.05)
for i in range(2):
    ax[i].set_xlabel('z mag')
ax[0].set_ylabel('redshift')
for i in range(2):
    ax[i].set_xlim(19,26)
    ax[i].set_ylim(0.5,1.7)
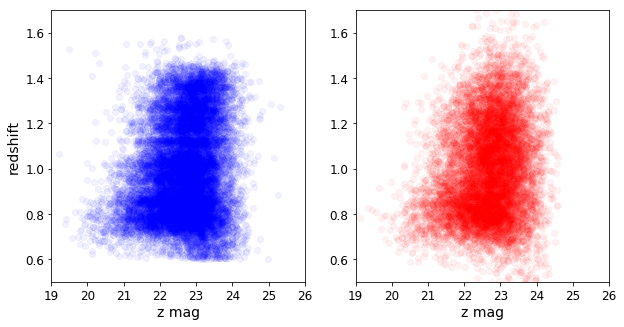
In [94]:
fig,ax= plt.subplots(2,2,figsize=(10,10))
ax[0,0].scatter(df_notdev['r-z'],df_notdev['redshift'],color='b',alpha=0.05)
ax[0,1].scatter(df_pred['r-z'],df_pred['redshift'],color='r',alpha=0.05)
for i in range(2):
    ax[0,i].set_xlabel('r-z')
    ax[0,i].set_xlim(-0.6,3)
    ax[0,i].set_ylim(0.2,2)

ax[1,0].scatter(df_notdev['g-r'],df_notdev['redshift'],color='b',alpha=0.05)
ax[1,1].scatter(df_pred['g-r'],df_pred['redshift'],color='r',alpha=0.05)
for i in range(2):
    ax[1,i].set_xlabel('g-r')
    ax[1,i].set_xlim(-2,2)
    ax[1,i].set_ylim(0.2,2)

for i in range(2):
    ax[i,0].set_ylabel('redshift')
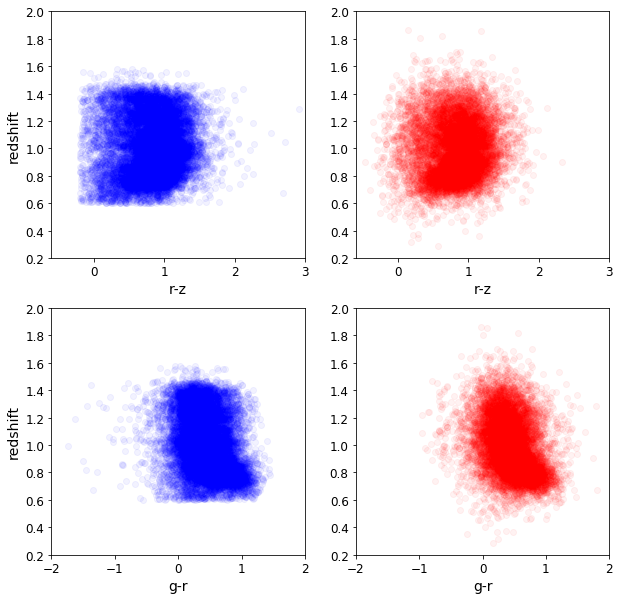
In [96]:
sns.distplot(df_new['fwhm_or_rhalf'])
df_new['fwhm_or_rhalf'].describe()
Out[96]:
count    15919.000000
mean         0.537243
std          0.271235
min          0.113250
25%          0.320844
50%          0.536520
75%          0.678899
max          4.954905
Name: fwhm_or_rhalf, dtype: float64
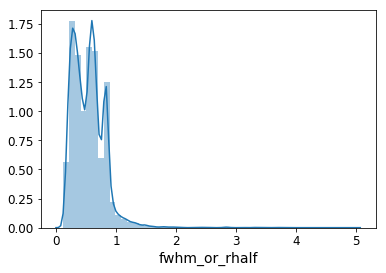
In [97]:
print(fit_cols)
['fwhm_or_rhalf', 'g-r', 'r-z', 'z', 'redshift']
Sample = Model
Starting sample of 10k
In [124]:
Xpred,Ypred= gmm.sample(10000)

fig,ax= plt.subplots(2,3,figsize=(14,10))

_=ax[0,0].hist(Xpred[:,3],bins=20,histtype='step',color='r',normed=True)
ax[0,0].set_xlabel('z mag')

_=ax[0,1].hist(np.sum(Xpred[:,2:3+1],axis=1),bins=20,histtype='step',color='r',normed=True)
ax[0,1].set_xlabel('r mag')

_=ax[0,2].hist(np.sum(Xpred[:,1:3+1],axis=1),bins=20,histtype='step',color='r',normed=True)
ax[0,2].set_xlabel('g mag')

_=ax[1,0].hist(Xpred[:,-1],bins=20,histtype='step',color='r',normed=True)
ax[1,0].set_xlabel('redshift')

_=ax[1,1].hist(Xpred[:,0],bins=20,histtype='step',color='r',normed=True)
ax[1,1].set_xlabel('fwhm_or_rhalf')
Out[124]:
<matplotlib.text.Text at 0x12390b208>
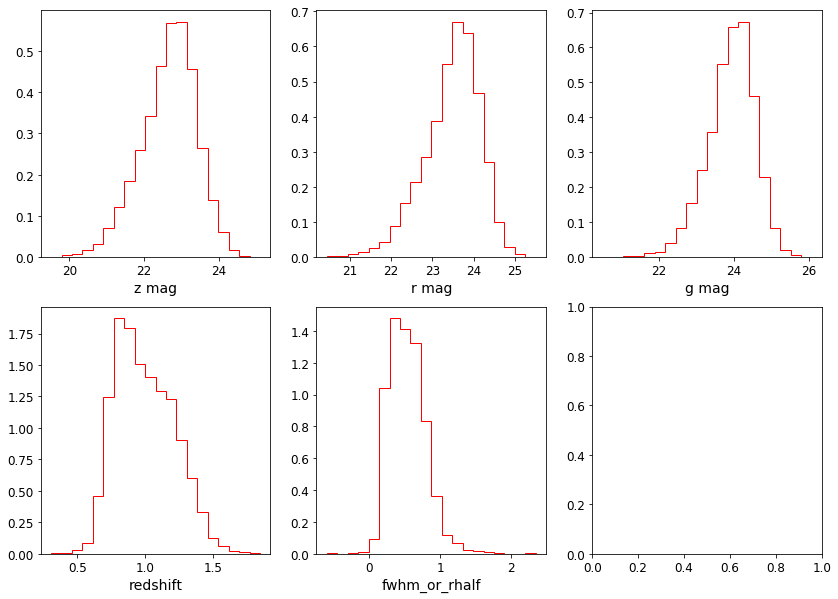
Resample until 10k within redshift and size limits
In [133]:
def ELGcuts(Xpred):
    """
    Args:
        Xpred: (N,5) array-like
            5 columns are:
            fit_cols= ['fwhm_or_rhalf', 'g-r', 'r-z','z','redshift']
    """
    red_lim= (0.6,1.6) # DESI
    rhalf_lim= (0.262/2,2.) # Camera, Data
    g,r,z= tuple(np.array([24.0,23.4,22.5])+0.5)
    return ((Xpred[:,0] < rhalf_lim[0]) |
            (Xpred[:,0] > rhalf_lim[1]) |
            (Xpred[:,-1] < red_lim[0]) |
            (Xpred[:,-1] > red_lim[1]) |
            (Xpred[:,3] >= z) | #beyond mag limit
            (np.sum(Xpred[:,2:3+1],axis=1) >= r) |
            (np.sum(Xpred[:,1:3+1],axis=1) >= g)
            )

Xpred,Ypred= gmm.sample(10000)
i=0
outLimit= ELGcuts(Xpred)
num= len(Ypred[outLimit])
while num > 0:
    i+=1
    if i > 20:
        raise ValueError
    print(num)
    Xpred[outLimit,:],Ypred[outLimit]= gmm.sample(num)
    outLimit= ELGcuts(Xpred)
    num= len(Ypred[outLimit])
4345
1934
881
382
177
88
39
17
7
3
1
1
1
In [134]:
d={}
for i,col in enumerate(fit_cols):
    d[col]= Xpred[:,i]
df_fin= pd.DataFrame(d)
In [135]:
fig,ax= plt.subplots(1,2,figsize=(10,5))
ax[0].scatter(df_new['r-z'],df_new['g-r'],color='b',alpha=0.05)
ax[1].scatter(df_fin['r-z'],df_fin['g-r'],color='r',alpha=0.05)
for i in range(2):
    ax[i].set_xlabel('r-z')
    ax[i].set_xlim(-0.5,2.5)
    ax[i].set_ylim(-1,2)
ax[0].set_ylabel('g-r')
Out[135]:
<matplotlib.text.Text at 0x123d1a358>
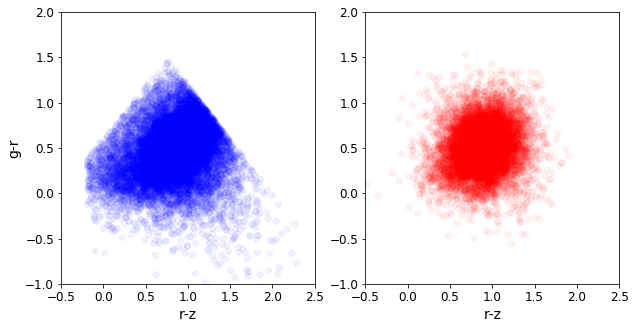
The GM mixture produced a sample that was then filtered to our redshift and mag limits
In [137]:
fig,ax= plt.subplots(2,3,figsize=(14,10))

_,bins,_= ax[0,0].hist(df_new['z'],bins=20,histtype='step',color='b',normed=True)
_=ax[0,0].hist(df_fin['z'],bins=20,histtype='step',color='r',normed=True)
ax[0,0].set_xlabel('z mag')

_,bins,_= ax[0,1].hist(df_new['r-z']+df_new['z'],bins=20,histtype='step',color='b',normed=True)
_=ax[0,1].hist(df_fin['r-z']+df_fin['z'],bins=20,histtype='step',color='r',normed=True)
ax[0,1].set_xlabel('r mag')

_,bins,_= ax[0,2].hist(df_new['g-r']+df_new['r-z']+df_new['z'],bins=20,histtype='step',color='b',normed=True)
_=ax[0,2].hist(df_fin['g-r']+df_fin['r-z']+df_fin['z'],bins=20,histtype='step',color='r',normed=True)
ax[0,2].set_xlabel('g mag')


_,bins,_= ax[1,0].hist(df_new['redshift'],bins=20,histtype='step',color='b',normed=True)
_=ax[1,0].hist(df_fin['redshift'],bins=20,histtype='step',color='r',normed=True)
ax[1,0].set_xlabel('redshift')

_,bins,_= ax[1,1].hist(df_new['fwhm_or_rhalf'],bins=20,histtype='step',color='b',normed=True)
_=ax[1,1].hist(df_fin['fwhm_or_rhalf'],bins=20,histtype='step',color='r',normed=True)
ax[1,1].set_xlabel('fwhm_or_rhalf')
Out[137]:
<matplotlib.text.Text at 0x12404f5f8>
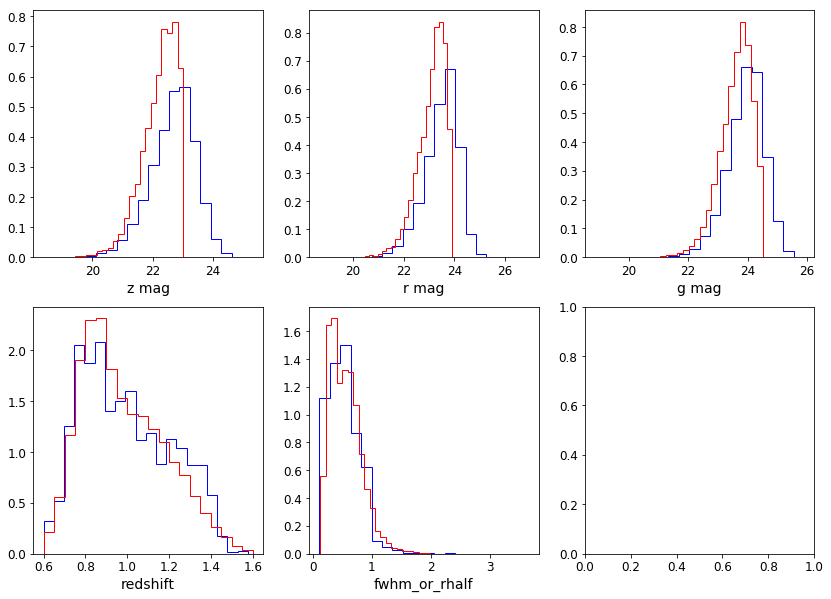
Save the model produced sample
In [138]:
df_fin.columns
a=fits_table()
a.set('id',np.arange(len(df_fin)))
a.set('rhalf',df_fin['fwhm_or_rhalf'].values)
a.set('redshift',df_fin['redshift'].values)
a.set('z',df_fin['z'].values)
a.set('r',df_fin['r-z'].values + a.z)
a.set('g',df_fin['g-r'].values + a.r)
a.writeto('elg_sample_5dim_10k.fits')
Model DEV
Fit Mixture
In [170]:
X= df_dev.values
print('Training Size=',X.shape[0])
gmms,i_min, n_comp, BICs= my_mixture(X,n_comp=np.arange(1,14))
plt.plot(n_comp,BICs)
Training Size= 225
2 components
Out[170]:
[<matplotlib.lines.Line2D at 0x128f70358>]
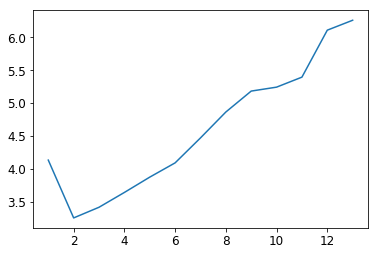
Cannot build a good model, simply not nough DEV data points
In [174]:
fig,ax= plt.subplots(3,2,figsize=(13,5))

for row,n in enumerate([2,6,10]):
    i= np.where(n_comp == n)[0][0]
    Xpred,Ypred= gmms[i].sample(10000)
    _,bins,_= ax[row,0].hist(df_dev['redshift'],bins=20,histtype='step',color='k',normed=True)
    _=ax[row,0].hist(Xpred[:,-1],bins=20,histtype='step',color='b',normed=True)
    #ax[1].set_xlabel('redshift')

    _,bins,_= ax[row,1].hist(df_dev['fwhm_or_rhalf'],bins=20,histtype='step',color='k',normed=True)
    _=ax[row,1].hist(Xpred[:,0],bins=20,histtype='step',color='b',normed=True)
    #ax[2].set_xlabel('fwhm_or_rhalf')

ax[2,0].set_xlabel('redshift')
ax[2,1].set_xlabel('fwhm_or_rhalf')
Out[174]:
<matplotlib.text.Text at 0x129deef28>
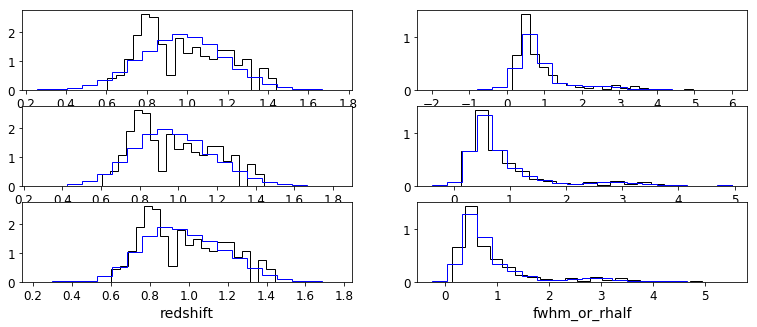
In [175]:
fig,ax= plt.subplots(3,3,figsize=(16,5))

for row,n in enumerate([2,6,10]):
    i= np.where(n_comp == n)[0][0]
    Xpred,Ypred= gmms[i].sample(10000)
    _,bins,_= ax[row,0].hist(df_dev['z'],bins=20,histtype='step',color='k',normed=True)
    _=ax[row,0].hist(Xpred[:,-2],bins=20,histtype='step',color='b',normed=True)

    _,bins,_= ax[row,1].hist(df_dev['r-z']+df_dev['z'],bins=20,histtype='step',color='k',normed=True)
    _=ax[row,1].hist(Xpred[:,-3]+Xpred[:,-2],bins=20,histtype='step',color='b',normed=True)

    _,bins,_= ax[row,2].hist(df_dev['g-r'] + df_dev['r-z']+df_dev['z'],bins=20,histtype='step',color='k',normed=True)
    _=ax[row,2].hist(Xpred[:,-4] + Xpred[:,-3] + Xpred[:,-2],bins=20,histtype='step',color='b',normed=True)

ax[2,0].set_xlabel('z')
ax[2,1].set_xlabel('r')
ax[2,2].set_xlabel('g')
Out[175]:
<matplotlib.text.Text at 0x12a389518>
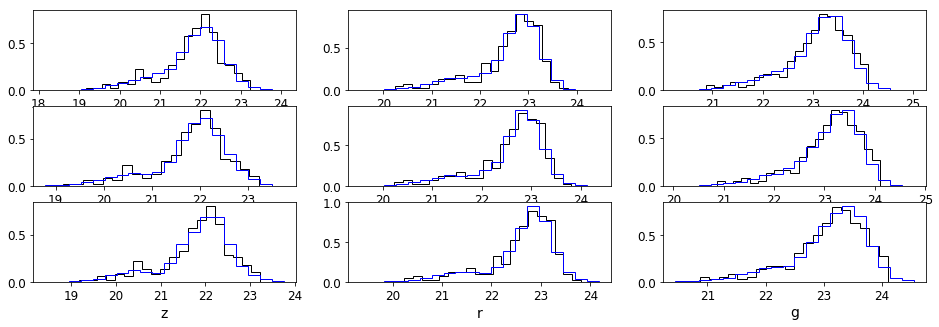
Model the DESI n(z)
100,000 random draws from sanches & kirkby, w/out replacement
In [232]:
z1e5= fits_table(os.path.join(DATA_DIR,'sanchez_kirkby_z1e5.fits'))
In [233]:
_=plt.hist(z1e5.z_cosmo,bins=20,histtype='step',color='b',normed=True)
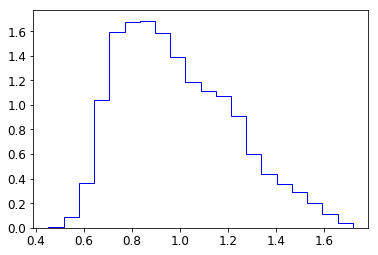
Fit Gaussian Mixture
In [234]:
X= z1e5.z_cosmo.reshape(-1,1)
gmms,i_min, n_comp, BICs= my_mixture(X)
plt.plot(n_comp,BICs)
4 components
Out[234]:
[<matplotlib.lines.Line2D at 0x11d4f5278>]
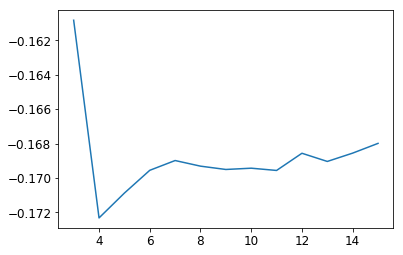
In [235]:
fig,ax= plt.subplots(1,3,figsize=(13,5))

for col,n in enumerate([4,8,12]):
    i= np.where(n_comp == n)[0][0]
    Xpred,Ypred= gmms[i].sample(10000)
    _=ax[col].hist(z1e5.z_cosmo,bins=20,histtype='step',color='b',normed=True)
    _=ax[col].hist(Xpred,bins=20,histtype='step',color='r',normed=True)

ax[2].set_xlabel('redshift')
Out[235]:
<matplotlib.text.Text at 0x11d5104a8>
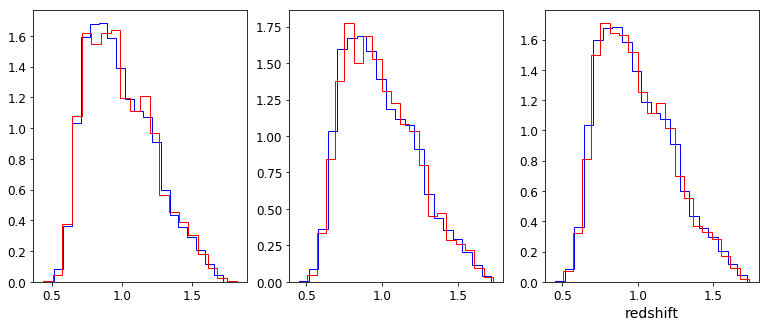
12 compoents to intentionally overfit (we want the exact n(z))
In [236]:
gmm= gmms[12]
z_pred,pdf_pred= gmm.sample(100000)
_=plt.hist(z1e5.z_cosmo,bins=20,histtype='step',color='b',normed=True)
_=plt.hist(z_pred,bins=20,histtype='step',color='r',normed=True)
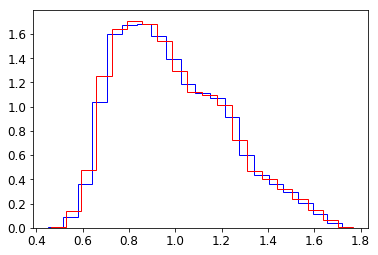
Save the model
In [239]:
GaussianMixtureModel.save(gmm, filename='elg_nz', py='36')
Wrote elg_nz_means_36.txt
Wrote elg_nz_weights_36.txt
Wrote elg_nz_covars_36.txt
Build our final sample (from the DR3-Deep2 and n(z) model)
In [5]:
from scipy import spatial
sample_5d_10k=fits_table('elg_sample_5dim_10k.fits')
from obiwan.common import fits2pandas
sample_5d_10k= fits2pandas(sample_5d_10k)

tree = spatial.KDTree(sample_5d_10k['redshift'].values.reshape(-1,1))
In [253]:
gmm.covariances_.shape
Out[253]:
(15, 1, 1)
In [9]:
model= GaussianMixtureModel.load(filename='elg_nz',py='36',is1D=True)
In [13]:
z= model.sample(1000)
_,ind= tree.query(z)
randoms= sample_5d_10k.iloc[ind]

print(len(sample_5d_10k),len(z),len(randoms))
print(randoms.columns), print(sample_5d_10k.columns)
(15,)
10000 1000 1000
Index(['g', 'id', 'r', 'redshift', 'rhalf', 'z'], dtype='object')
Index(['g', 'id', 'r', 'redshift', 'rhalf', 'z'], dtype='object')
Out[13]:
(None, None)
In [18]:
for i in range(10):
    print(z[i],randoms['redshift'].iloc[i])
[ 1.17863478] 1.17876047504
[ 1.17322301] 1.17322153666
[ 1.1506008] 1.15054300718
[ 1.19767244] 1.19775757811
[ 1.19893259] 1.19892718065
[ 1.15093723] 1.15096243379
[ 1.15994011] 1.15990993527
[ 1.15066201] 1.15067316369
[ 1.13602797] 1.13600715492
[ 1.15877533] 1.1587258549
In [306]:
# Randoms table
a=fits_table()
a.set('id',np.arange(len(randoms)))
a.set('id_5d10k_sample',randoms['id'].values)
a.set('rhalf',randoms['rhalf'].values)
a.set('redshift',randoms['redshift'].values)
a.set('z',randoms['z'].values)
a.set('r',randoms['r'].values)
a.set('g',randoms['g'].values)
a.writeto('randoms_1.fits')
Final sample has DR3-Deep2 color, shape, size AND DESI n(z)
In [139]:
fig,ax= plt.subplots(1,3,figsize=(12,5))
ax[0].scatter(df_fin['r-z'],df_fin['g-r'],color='b',alpha=0.05)
ax[1].scatter(randoms['r-z'],randoms['g-r'],color='r',alpha=0.05)
_=ax[2].hist(z_10k.z_cosmo,bins=20,histtype='step',color='b',normed=True)
_=ax[2].hist(randoms['redshift'],bins=20,histtype='step',color='r',normed=True)
for i in range(2):
    ax[i].set_xlabel('r-z')
    ax[i].set_xlim(-0.5,2.5)
    ax[i].set_ylim(-1,2)
ax[0].set_ylabel('g-r')
ax[2].set_xlabel('redshift')
Out[139]:
<matplotlib.text.Text at 0x122cdfa20>
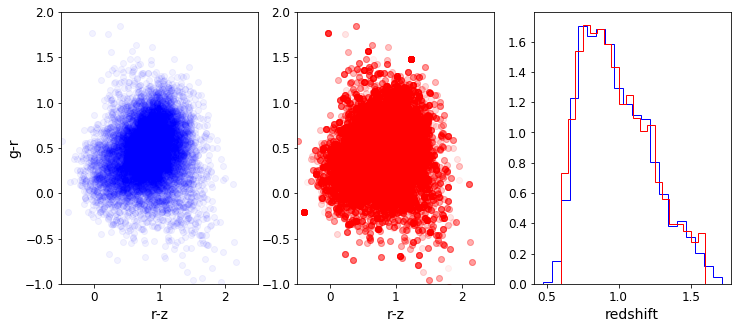
In [8]:
tenk= fits_table('../../etc/elg_sample_5dim_10k.fits')
42% is in the TS box
In [14]:
gr= tenk.g - tenk.r
rz= tenk.r - tenk.z
inBox= ((gr <= y1_line(rz)) &
        (gr <= y2_line(rz)) &
        (rz >= 0.3) &
        (rz <= 1.6))
plt.scatter(rz,gr,color='b',alpha=0.1)
plt.scatter(rz[inBox],gr[inBox],color='r',alpha=0.1)
print(len(rz[inBox])/float(len(rz)))
0.4201
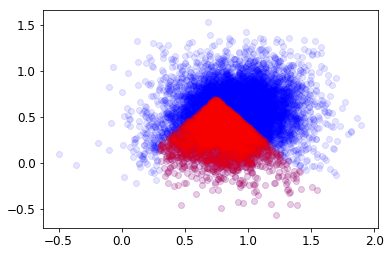
Cosmos Randoms
In [29]:
r= fits_table('/Users/kaylan1/Downloads/randoms_seed_1_startid_1.fits')
ra,dec= [149.7, 150.8],[1.6, 2.7]
r.get_columns()
Out[29]:
['id', 'ra', 'dec', 'n', 'rhalf', 'g', 'r', 'z', 'ba', 'pa']
In [36]:
plt.scatter(r.ra,r.dec,s=2,alpha=0.01)
for i in range(2):
    plt.axvline(ra[i],ls='--',c='k')
    plt.axhline(dec[i],ls='--',c='k')
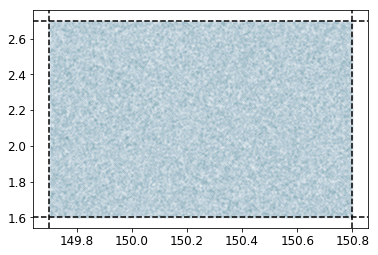
In [31]:
set(r.n), len(r.n[r.n == 1]), len(r.n[r.n == 4]), set(r.rhalf)
Out[31]:
({1.0, 4.0}, 120000, 120000, {0.5})
In [32]:
len(r),len(set(r.id))
Out[32]:
(240000, 240000)
In [37]:
plt.scatter(r.ba,r.pa,s=2,alpha=0.01)
Out[37]:
<matplotlib.collections.PathCollection at 0x1188bcd30>
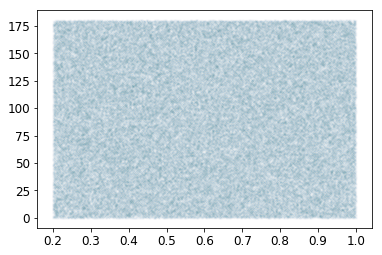
In [34]:
limit= dict(g=24.0,
            r=23.4,
            z=22.5)
for b,color in zip('grz','gbk'):
    lo,hi= limit[b]-2, limit[b]+0.5
    bins= np.linspace(lo-0.5,hi+0.5,num=30)
    _= plt.hist(r.get(b),bins=bins,color=color,histtype='step',
                label=b,lw=2)
    plt.axvline(lo,ls='--',c=color)
    plt.axvline(hi,ls='--',c=color)
plt.legend()
Out[34]:
<matplotlib.legend.Legend at 0x116319d68>
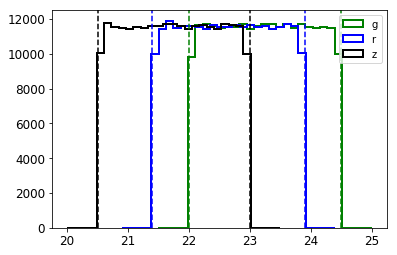
In [35]:
def isElg(g,r,z):
    return ((r < 23.4) &
            (r-z > 0.3) &
            (r-z < 1.6) &
            (g-r < 1.15*(r-z) - 0.15) &
            (g-r < 1.6 - 1.2*(r-z))
           )
print('fraction TS ELG = %f' % (len(r[isElg(r.g,r.r,r.z)])/len(r)))
fraction TS ELG = 0.119608