10 deg2 Test Region
In [1]:
import numpy as np
import os
import pandas as pd
import itertools
from PIL import Image
import seaborn as sns
import fitsio
import skimage.io

# to make this notebook's output stable across runs
np.random.seed(7)

# To plot pretty figures
%matplotlib inline
import matplotlib
import matplotlib.pyplot as plt
plt.rcParams['axes.labelsize'] = 14
plt.rcParams['xtick.labelsize'] = 12
plt.rcParams['ytick.labelsize'] = 12

%load_ext autoreload
%autoreload 2
In [2]:
REPO_DIR= os.path.join(os.environ['HOME'],
                       'myrepo/obiwan')
DATA_DIR= os.path.join(os.environ['HOME'],
                       'mydata')
In [3]:
from astrometry.util.fits import fits_table, merge_tables
from obiwan.common import fits2pandas
In [4]:
simcat=fits_table(os.path.join(DATA_DIR,
                 '1741p242','rs0/obiwan',
                 'simcat-elg-1741p242.fits'))
skipid=fits_table(os.path.join(DATA_DIR,
                 '1741p242','rs0/obiwan',
                 'skippedids-elg-1741p242.fits'))

obitractor= fits_table(os.path.join(DATA_DIR,
                 '1741p242','rs0/tractor',
                 'tractor-1741p242.fits'))

dr5tractor= fits_table(os.path.join(DATA_DIR,
                 '1741p242','dr5',
                 'tractor-1741p242.fits'))
In [5]:
len(simcat),len(skipid), simcat.get_columns()
Out[5]:
(282,
 18,
 ['id',
  'seed',
  'ra',
  'dec',
  'x',
  'y',
  'gflux',
  'rflux',
  'zflux',
  'sersicn',
  'rhalf',
  'ba',
  'phi'])
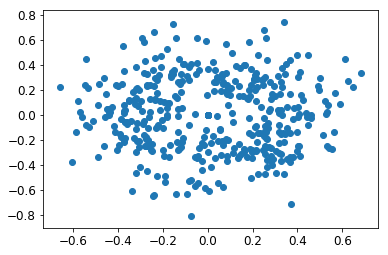
In [8]:
plt.scatter(dr5tractor.shapeexp_e1,dr5tractor.shapeexp_e2)
Out[8]:
<matplotlib.collections.PathCollection at 0x7f690b687a90>
In [6]:
def readImage(fn,jpeg=False):
    """Reads FITS and jpeg images so that x,y indices refer to the same pixels
    regardless of image format. x,y and fits correspond so the jpeg is rotated and flipped
    to align with fits

    Args:
        fn: image filename
        jpeg: bool, is is a jpeg?
    """
    if jpeg:
        img= skimage.io.imread(fn)
        for i in range(3):
            img[:,:,i]= np.rot90(img[:,:,i].T,1)
    else:
        img= fitsio.FITS(fn)[1].read()
    return img

def sliceImage(img,
               xslice=slice(None,None),yslice=slice(None,None)):
    """Not sure why, but simcat.x[xslice],simcat.y[yslice]
    corresponds to img[yslice,xslice], eg inverted for the image"""
    return img[yslice,xslice,...]

class plotImage(object):
    """Helper functions for displaying image and overlaying circles around sources

    Args:
        img: need to give as initial input b/c some helper funcs that dont directly
            use img, need its shape at least, see circles()
    """
    def imshow(self,img,ax,qs=[0.5,99.5]):
        if img.shape[-1] == 3:
            #minmax=np.percentile(np.sum(img,axis=2),q=qs)
            minmax=[None,None]
            cmap=None
        else:
            minmax=np.percentile(img,q=qs)
            cmap='gray'
        ax.imshow(img, interpolation='none', origin='lower',
                  cmap=cmap,vmin=minmax[0],vmax=minmax[1])
        ax.tick_params(direction='out')

    def circles(self,xs,ys,ax,
                img_shape=None,
                xslice=None,yslice=None,
                r_pixels=5./0.262,color='y'):
        """
        xs,ys: x,y positions of sources in pixels, e.g. tractor.bx or simcat.x
        img_shape: needed when xslice or yslice is None
        xlice,yslice: slice() objects into the image array
        r_pixels: radius circles in pixels
        """
        if (xslice is None) | (yslice is None):
            assert(not img_shape is None)
        if xslice is None:
            xslice= slice(0,img_shape[0])
        if yslice is None:
            yslice= slice(0,img_shape[1])
        keep= self.justInSlice(xs,ys,xslice,yslice)
        xpos,ypos= xs[keep]-xslice.start,ys[keep]-yslice.start

        from matplotlib.patches import Circle,Wedge
        from matplotlib.collections import PatchCollection
        dr= r_pixels/ 20
        patches=[Wedge((x, y), r_pixels + dr, 0, 360,dr)
                 for x,y in zip(xpos, ypos) ]
        coll = PatchCollection(patches, color=color) #,alpha=1)
        ax.add_collection(coll)

    def justInSlice(self,x,y,xslice,yslice):
        """Returns bool array of x,y positions in the slice()"""
        return ((x >= xslice.start) &
               (x <= xslice.stop) &
               (y >= yslice.start) &
               (y <= yslice.stop))
In [7]:
img_dr5_g= readImage(os.path.join(DATA_DIR,
'1741p242','dr5',
'legacysurvey-1741p242-image-g.fits.fz'))
img_dr5_r= readImage(os.path.join(DATA_DIR,
'1741p242','dr5',
'legacysurvey-1741p242-image-r.fits.fz'))
img_dr5_z= readImage(os.path.join(DATA_DIR,
'1741p242','dr5',
'legacysurvey-1741p242-image-z.fits.fz'))
img_obi_g= readImage(os.path.join(DATA_DIR,
'1741p242','rs0/coadd',
'legacysurvey-1741p242-image-g.fits.fz'))
img_obi_r= readImage(os.path.join(DATA_DIR,
'1741p242','rs0/coadd',
'legacysurvey-1741p242-image-r.fits.fz'))
img_obi_z= readImage(os.path.join(DATA_DIR,
'1741p242','rs0/coadd',
'legacysurvey-1741p242-image-z.fits.fz'))
img_jpg= readImage(os.path.join(DATA_DIR,
'1741p242','rs0/coadd',
'legacysurvey-1741p242-image.jpg'),
jpeg=True)
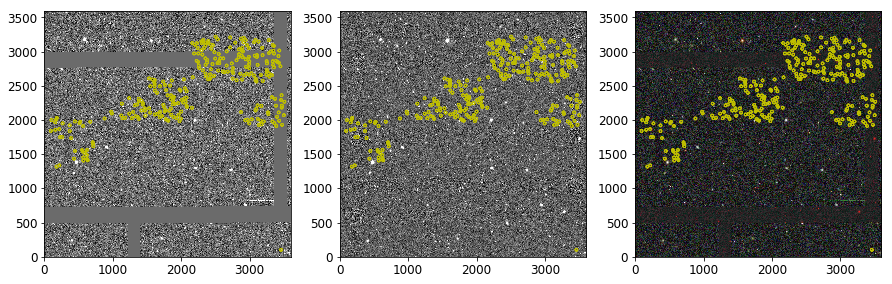
fig,ax= plt.subplots(1,3,figsize=(15,5))
plotImage().imshow(img_obi_r,ax[0])
plotImage().imshow(img_obi_z,ax[1])
plotImage().imshow(img_jpg,ax[2])
for i in range(3):
plotImage().circles(simcat.x,simcat.y,ax[i],
img_shape=img_obi_z.shape)
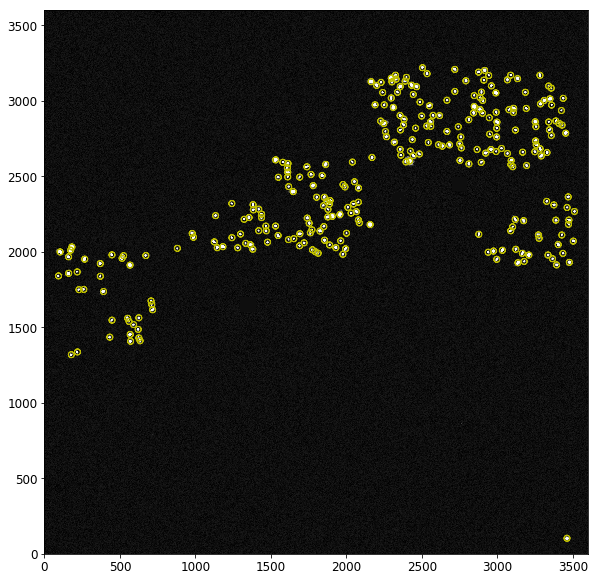
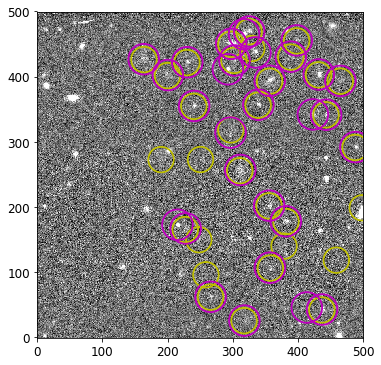
In [8]:
fig,ax= plt.subplots(figsize=(10,10))
plotImage().imshow(img_obi_z - img_dr5_z,ax)
plotImage().circles(simcat.x,simcat.y,ax,
                    img_shape=img_obi_z.shape)
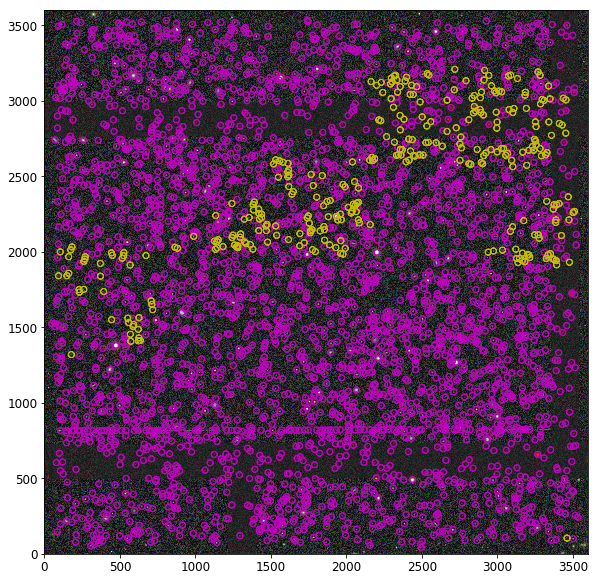
Sources are clustered in the Data Base
In [1]:
print("Yellow: first 300 from DB, Magenta: all")
Yellow: first 300 from DB, Magenta: all
In [9]:
fig,ax= plt.subplots(figsize=(10,10))
plotImage().imshow(img_jpg,ax)
plotImage().circles(dr5tractor.bx,dr5tractor.by,ax,
                    img_shape=img_jpg[:,:,0].shape,
                    color='m')
plotImage().circles(obitractor.bx,obitractor.by,ax,
                    img_shape=img_jpg[:,:,0].shape,
                    color='y')
In [10]:
xslc,yslc= slice(2500,3000), slice(2500,3000)

fig,ax= plt.subplots(1,2,figsize=(10,5))
plotImage().imshow(sliceImage(img_obi_r - img_dr5_r,xslc,yslc),ax[0])
plotImage().imshow(sliceImage(img_obi_z - img_dr5_z,xslc,yslc),ax[1])
for i in range(2):
    plotImage().circles(simcat.x,simcat.y,ax[i],
                        xslice=xslc,yslice=yslc)
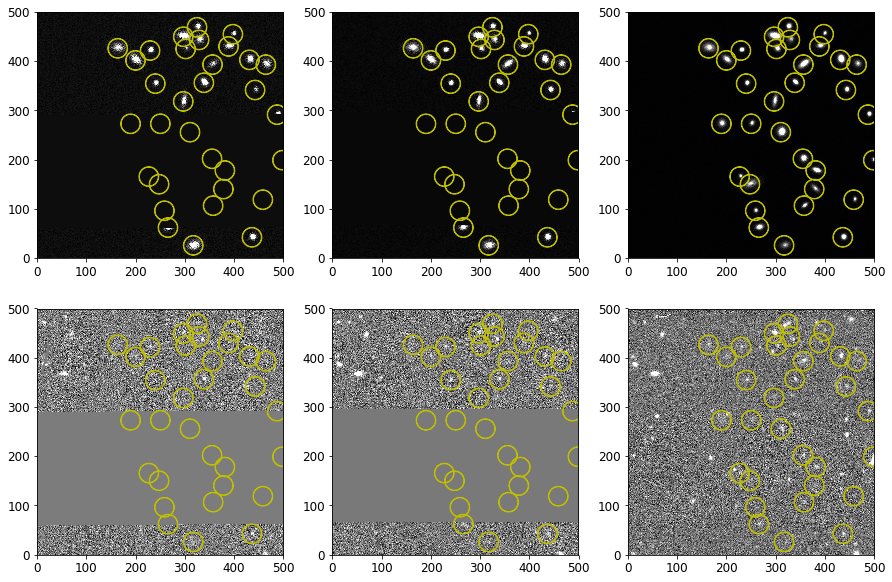
In [11]:
xslc,yslc= slice(2000,2500), slice(2700,3200)

fig,ax= plt.subplots(2,3,figsize=(15,10))
plotImage().imshow(sliceImage(img_obi_g - img_dr5_g,xslc,yslc),ax[0,0])
plotImage().imshow(sliceImage(img_obi_r - img_dr5_r,xslc,yslc),ax[0,1])
plotImage().imshow(sliceImage(img_obi_z - img_dr5_z,xslc,yslc),ax[0,2])
plotImage().imshow(sliceImage(img_obi_g,xslc,yslc),ax[1,0])
plotImage().imshow(sliceImage(img_obi_r,xslc,yslc),ax[1,1])
plotImage().imshow(sliceImage(img_obi_z,xslc,yslc),ax[1,2])
for i in range(3):
    plotImage().circles(simcat.x,simcat.y,ax[0,i],
                        xslice=xslc,yslice=yslc)
    plotImage().circles(simcat.x,simcat.y,ax[1,i],
                        xslice=xslc,yslice=yslc)
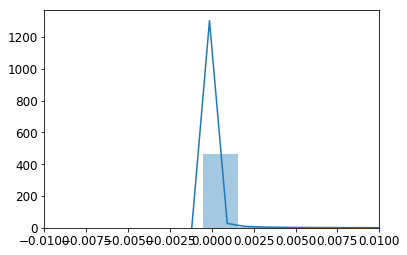
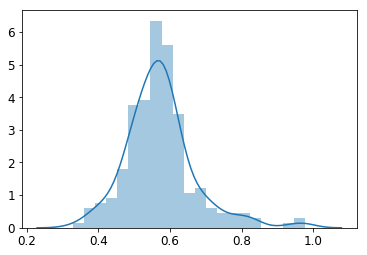
In [12]:
import seaborn as sns
sns.distplot(sliceImage(img_obi_z-img_dr5_z,xslc,yslc).flatten()) #,s=np.linspace(-0.01,0.01,num=100))
plt.xlim(-0.01,0.01)
Out[12]:
(-0.01, 0.01)
In [13]:
xslc,yslc= slice(2000,2500), slice(2700,3200)

fix,ax=plt.subplots(figsize=(12,6))
plotImage().imshow(sliceImage(img_obi_z,xslc,yslc),ax)
# NOTE: x pixel - y slice start IS correct
plotImage().circles(simcat.x,simcat.y,ax,
                    xslice=xslc,yslice=yslc,color='y',r_pixels=5/0.262)
plotImage().circles(obitractor.bx,obitractor.by,ax,
                    xslice=xslc,yslice=yslc,color='m',r_pixels=6/0.262)
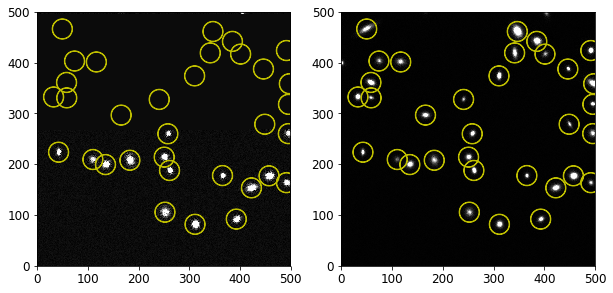
Recovered sources are within 1 arcsec
In [14]:
def not_index(indices,n):
    keep=np.ones(n,bool)from astrometry.libkd.spherematch import match_radec
isim,itrac,d= match_radec(simcat.ra, simcat.dec, obitractor.ra, obitractor.dec,
                          1./3600.0,nearest=True)
    keep[indices]=False
    return np.arange(n)[keep]

from astrometry.libkd.spherematch import match_radec
isim,itrac,d= match_radec(simcat.ra, simcat.dec, obitractor.ra, obitractor.dec,
                          1./3600.0,nearest=True)
not_isim= not_index(isim,len(simcat))
not_itrac= not_index(itrac,len(obitractor))
sns.distplot(d*3600)
Out[14]:
<matplotlib.axes._subplots.AxesSubplot at 0x7f02b9077350>
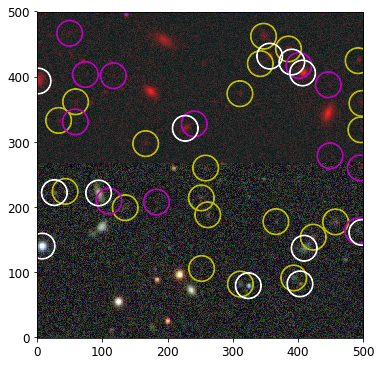
In [15]:
xslc,yslc= slice(2500,3000), slice(2500,3000)

fix,ax=plt.subplots(figsize=(12,6))
plotImage().imshow(sliceImage(img_jpg,xslc,yslc),ax)
# Recovered
plotImage().circles(obitractor.bx[itrac],obitractor.by[itrac],ax,
        xslice=xslc,yslice=yslc,
        color='y',r_pixels=5/0.262)
# Missed
plotImage().circles(simcat.x[not_isim],simcat.y[not_isim],ax,
        xslice=xslc,yslice=yslc,
        color='m',r_pixels=5/0.262)
# Real
plotImage().circles(obitractor.bx[not_itrac],obitractor.by[not_itrac],ax,
        xslice=xslc,yslice=yslc,
        color='w',r_pixels=5/0.262)
In [16]:
xslc,yslc= slice(2500,3200),slice(2300,3500)

fix,ax=plt.subplots(figsize=(8,12))
plotImage().imshow(sliceImage(img_jpg,xslc,yslc),ax)
# Recovered
plotImage().circles(obitractor.bx[itrac],obitractor.by[itrac],ax,
        xslice=xslc,yslice=yslc,
        color='y',r_pixels=5/0.262)
# Missed
plotImage().circles(simcat.x[not_isim],simcat.y[not_isim],ax,
        xslice=xslc,yslice=yslc,
        color='m',r_pixels=5/0.262)
# Real
plotImage().circles(obitractor.bx[not_itrac],obitractor.by[not_itrac],ax,
        xslice=xslc,yslice=yslc,
        color='w',r_pixels=5/0.262)
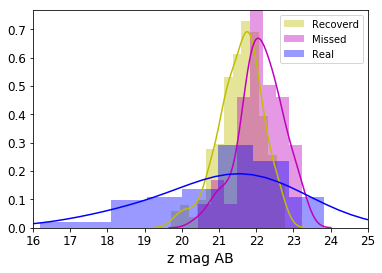
Brightness distribution of Missed, Recovered, and Real sources
In [17]:
class Flux2mag(object):
    """convert simcat or tractor fluxes, NaN where flux <= 0

    Note: both fluxes have units of nanomaggies, however simcat fluxes
    are corrected while tractor fluxes do not correct for
    extinction
    """
    def __init__(self):
        print('WARNING:Neither simcat or tractor fluxes are extinction corrected')

    def simcat(self,flux):
        mag= np.zeros(len(flux))-1
        keep= flux > 0
        mag[keep]= -2.5*np.log10(1e-9 * flux[keep])
        return np.ma.masked_array(mag,
                                  mask= flux <= 0)

    def tractor(self,flux,mw_ext):
        raw_mag= self.simcat(flux)
        return raw_mag #- mw_ext[keep]

F= Flux2mag()
sns.distplot(F.simcat(simcat.zflux[isim]),color='y',label='Recoverd')
sns.distplot(F.simcat(simcat.zflux[not_isim]),color='m',label='Missed')
sns.distplot(F.tractor(obitractor.flux_z[not_itrac],
                       obitractor.mw_transmission_z[not_itrac]),
             color='b',label='Real')
plt.xlabel('z mag AB')
plt.xlim(16,25)
plt.legend()
WARNING:Neither simcat or tractor fluxes are extinction corrected
Out[17]:
<matplotlib.legend.Legend at 0x7f02b9099910>
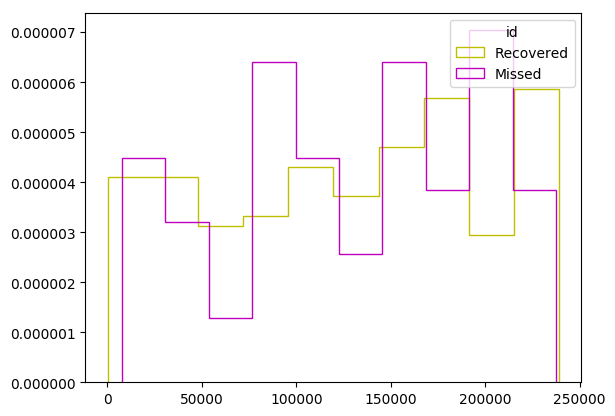
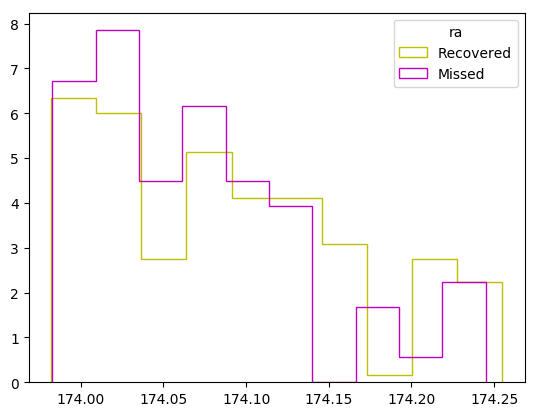
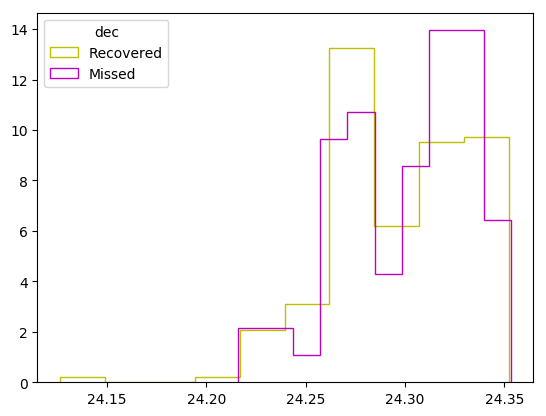
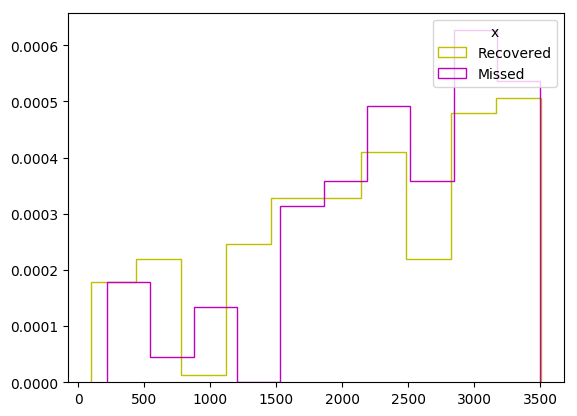
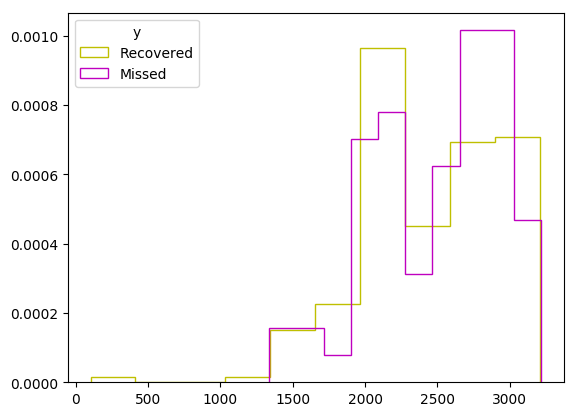
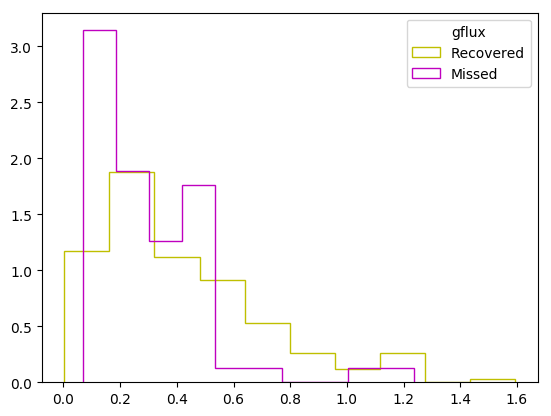
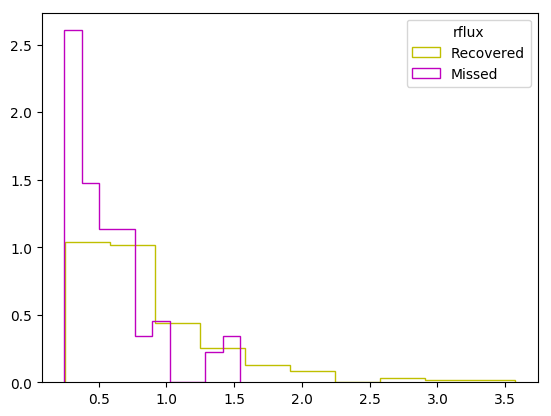
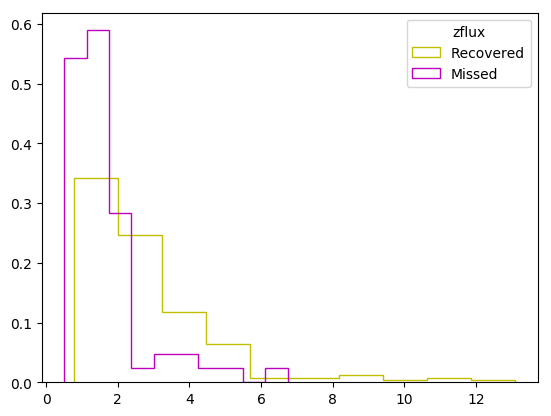
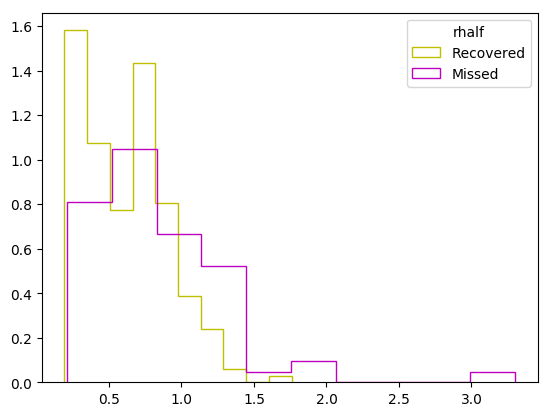
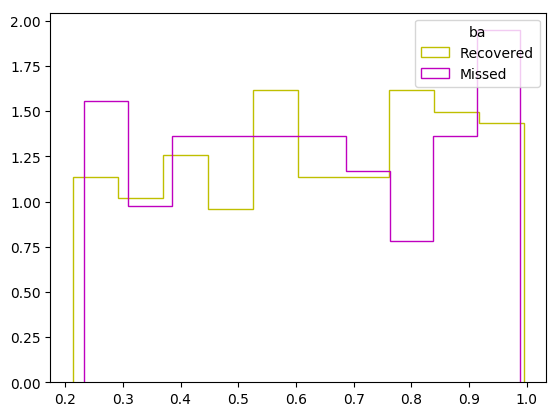
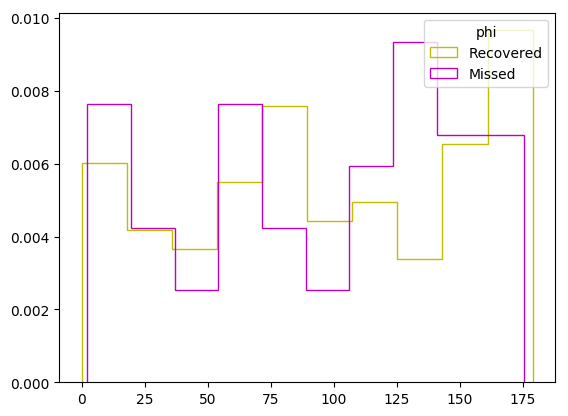
Missed or Recovered only depends on source brightness
In [18]:
def myhist(x,c='b',lab='',normed=True):
    sns.reset_orig()
    _= plt.hist(x,histtype='step',normed=normed,
                color=c,label=lab)

for var in simcat.get_columns():
    for indices,lab,c in zip([isim,not_isim],['Recovered','Missed'],['y','m']):
        myhist(simcat.get(var)[indices],c=c,lab=lab)
    plt.legend(title=var)
    plt.show()

In [19]:
def get_q25(x):
    return np.percentile(x,q=25)

def get_q50(x):
    return np.percentile(x,q=50)

def get_q75(x):
    return np.percentile(x,q=75)


new= pd.DataFrame({
    'trac_mag':F.tractor(obitractor.flux_z[itrac],
                         obitractor.mw_transmission_z[itrac]),
    'sim_mag':F.simcat(simcat.zflux[isim])
    })
new['diff']= new['sim_mag'] - new['trac_mag']
#W=0.2
#LO,HI=new['sim_mag'].min()-W,new['sim_mag'].max()
#new['bins']= pd.cut(new['sim_mag'],bins=np.arange(LO,HI+W*2,W))
new['bins']= pd.cut(new['sim_mag'],bins=15)
a= new.groupby('bins').agg([get_q25,get_q50,get_q75])
a.head()
#new['bins'].cat.categories.mid
Out[19]:
| sim_mag | trac_mag | diff | |||||||
|---|---|---|---|---|---|---|---|---|---|
| get_q25 | get_q50 | get_q75 | get_q25 | get_q50 | get_q75 | get_q25 | get_q50 | get_q75 | |
| bins | |||||||||
| (19.704, 19.913] | 19.758501 | 19.809545 | 19.860590 | 19.713614 | 19.779356 | 19.845098 | 0.015492 | 0.030189 | 0.044887 |
| (19.913, 20.118] | 19.953417 | 19.982250 | 20.028189 | 19.948938 | 19.950054 | 20.037999 | -0.037527 | -0.023239 | 0.004479 |
| (20.118, 20.323] | 20.146553 | 20.161123 | 20.207467 | 20.278008 | 20.286423 | 20.315403 | -0.160436 | -0.137611 | -0.085111 |
| (20.323, 20.528] | 20.394506 | 20.421235 | 20.424951 | 20.376431 | 20.451448 | 20.493268 | -0.068317 | -0.030213 | 0.018075 |
| (20.528, 20.733] | 20.630314 | 20.653788 | 20.670790 | 20.600925 | 20.657610 | 20.695587 | -0.016108 | 0.001160 | 0.021018 |
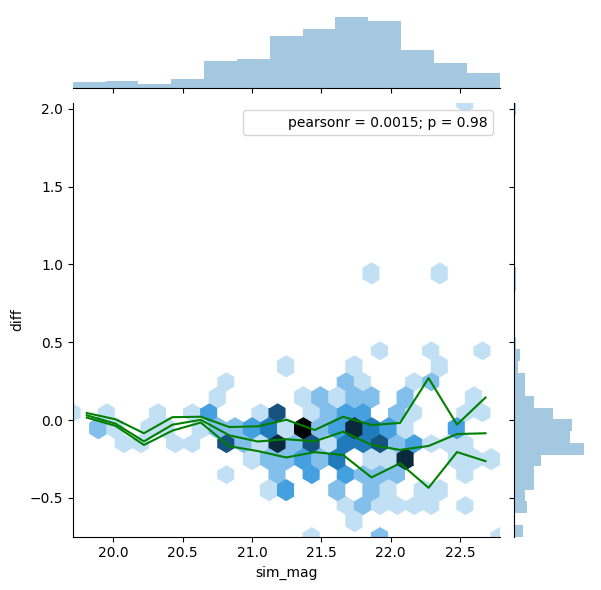
Truth - Measured (binned by magnitude)
In [20]:
g = sns.jointplot(x="sim_mag", y="diff", data=new,
                  kind='hex')
binc= a.index.categories.mid
g.ax_joint.plot(binc,a['diff']['get_q25'],'g-')
g.ax_joint.plot(binc,a['diff']['get_q50'],'g-')
g.ax_joint.plot(binc,a['diff']['get_q75'],'g-')
Out[20]:
[<matplotlib.lines.Line2D at 0x7f02b8ee5e10>]
In [21]:
print(set(np.char.strip(obitractor.get('type'))))
len(obitractor[obitractor.allmask_z != 0]),len(obitractor[obitractor.anymask_z != 0])
set(['COMP', 'REX', 'PSF', 'EXP', 'DEV'])
Out[21]:
(1, 16)
In [22]:
objtypes= ['psf','rex','exp','dev','comp']

def get_tractor_cuts(tractor):
    cuts= {} #{'photometric':np.ones(len(tractor),bool)}
    for b in ['g','r','z']:
        cuts['phot_'+b]= ((tractor.get('flux_'+b) > 0) &
                          (tractor.get('flux_ivar_'+b) > 0) &
                          (tractor.get('allmask_'+b) == 0))
    for col in objtypes:
        cuts[col]= np.char.strip(tractor.get('type')) == col.upper()
    return cuts

cuts_obitractor= get_tractor_cuts(obitractor)
In [23]:
def indices2bool(indices,n):
keep= np.zeros(n,bool)
keep[indices]=True
return keep
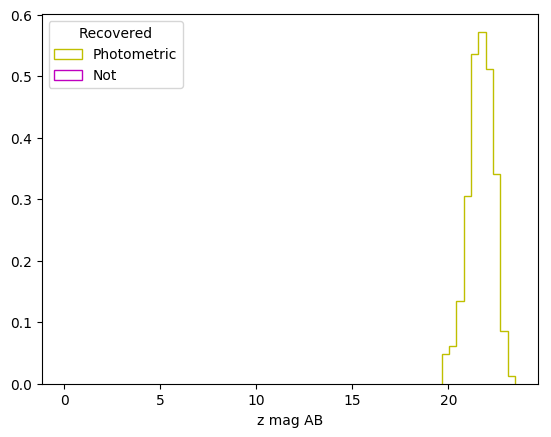
#Recovered
btrac= indices2bool(itrac,len(obitractor))
for bcut,lab,c in zip([cuts_obitractor['phot_z'],
cuts_obitractor['phot_z'] == False],
['Photometric','Not'],['y','m']):
print(lab,' %d' % len(obitractor[(btrac) & (bcut)]))
myhist(F.tractor(obitractor.flux_z[(btrac) & (bcut)],
obitractor.mw_transmission_z[(btrac) & (bcut)]),
c=c,lab=lab)
plt.legend(title='Recovered')
plt.xlabel('z mag AB')
plt.show()
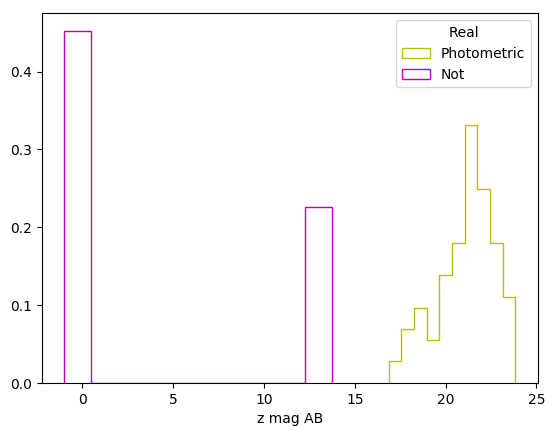
#Real
btrac= indices2bool(not_itrac,len(obitractor))
for bcut,lab,c in zip([cuts_obitractor['phot_z'],
cuts_obitractor['phot_z'] == False],
['Photometric','Not'],['y','m']):
print(lab,' %d' % len(obitractor[(btrac) & (bcut)]))
myhist(F.tractor(obitractor.flux_z[(btrac) & (bcut)],
obitractor.mw_transmission_z[(btrac) & (bcut)]),
c=c,lab=lab)
plt.legend(title='Real')
plt.xlabel('z mag AB')
plt.show()
#plt.xlim(16,25)
('Photometric', ' 214')
('Not', ' 0')
/home/kaylan/env_galsim/local/lib/python2.7/site-packages/matplotlib/axes/_axes.py:6201: RuntimeWarning: invalid value encountered in true_divide
  m = (m.astype(float) / db) / m.sum()
('Photometric', ' 104')
('Not', ' 3')
In [24]:
recovered= pd.DataFrame({
    'sim_mag':F.simcat(simcat.zflux[isim]),
    'isPhotZ':cuts_obitractor['phot_z'][isim]
})
recovered['bins']= pd.cut(recovered['sim_mag'],bins=15)
recovered.head()
Out[24]:
| isPhotZ | sim_mag | bins | |
|---|---|---|---|
| 0 | True | 21.451953 | (21.349, 21.554] |
| 1 | True | 22.592270 | (22.58, 22.785] |
| 2 | True | 21.624738 | (21.554, 21.759] |
| 3 | True | 21.212229 | (21.144, 21.349] |
| 4 | True | 21.583440 | (21.554, 21.759] |
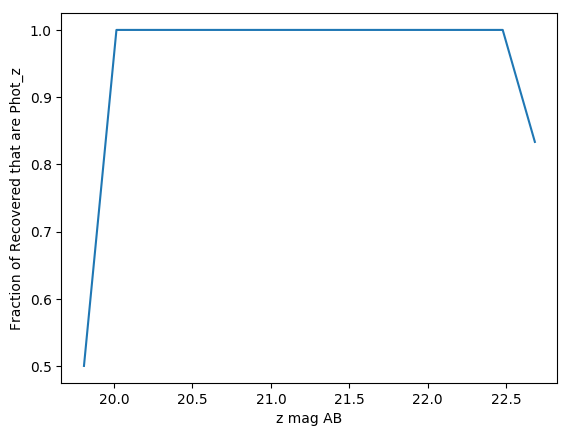
Recovered sources are all photometric (flux > 0, ivar > 0, allmaks)
In [25]:
result= recovered.groupby('bins').sum() / recovered.groupby('bins').count()
print(result.tail(5))

plt.plot(result.index.categories.mid,result['isPhotZ'])
#plt.axvline(result.index[result['isPhotz'] <= 0.5][0],c='r',ls='-')
plt.xlabel('z mag AB')
plt.ylabel('Fraction of Recovered that are Phot_z')
                   isPhotZ    sim_mag
bins
(21.759, 21.964]  1.000000  21.861761
(21.964, 22.17]   1.000000  22.074437
(22.17, 22.375]   1.000000  22.263788
(22.375, 22.58]   1.000000  22.497383
(22.58, 22.785]   0.833333  22.678082
Out[25]:
<matplotlib.text.Text at 0x7f02bb8cfd10>
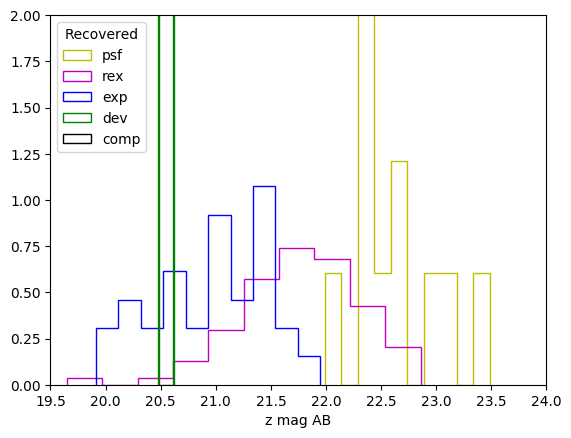
Recovered sources by “type”
In [26]:
#Recovered
btrac= indices2bool(itrac,len(obitractor))
for objtype,c in zip(objtypes,['y','m','b','g','k','gray']):
isObj= (cuts_obitractor[objtype]) & (btrac)
print(objtype,' %d' % len(obitractor[isObj]))
myhist(F.tractor(obitractor.flux_z[isObj],
obitractor.mw_transmission_z[isObj]),
c=c,lab=objtype,normed=True)
plt.legend(title='Recovered')
plt.xlabel('z mag AB')
plt.ylim(0,2)
plt.xlim(19.5,24)
plt.show()
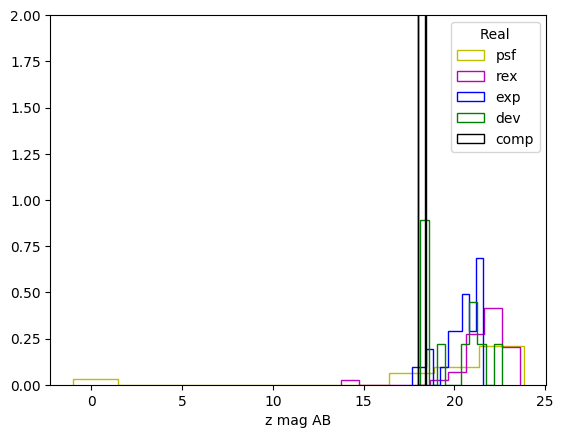
#Real
btrac= indices2bool(not_itrac,len(obitractor))
for objtype,c in zip(objtypes,['y','m','b','g','k','gray']):
isObj= (cuts_obitractor[objtype]) & (btrac)
print(objtype,' %d' % len(obitractor[isObj]))
myhist(F.tractor(obitractor.flux_z[isObj],
obitractor.mw_transmission_z[isObj]),
c=c,lab=objtype,normed=True)
plt.legend(title='Real')
plt.xlabel('z mag AB')
plt.ylim(0,2)
plt.show()
('psf', ' 11')
('rex', ' 169')
('exp', ' 32')
('dev', ' 2')
('comp', ' 0')
('psf', ' 25')
('rex', ' 44')
('exp', ' 26')
('dev', ' 10')
('comp', ' 2')
In [27]:
fraction= pd.DataFrame({
    'sim_mag':F.simcat(simcat.zflux),
    'isRecovered':indices2bool(isim,len(simcat))
})
fraction['bins']= pd.cut(fraction['sim_mag'],bins=15)
# W=0.2
# LO,HI=fraction['sim_mag'].min()-W,fraction['sim_mag'].max()
# fraction['binc']= np.zeros(len(fraction))
# for low,hi in zip(np.arange(LO,HI+W,W),np.arange(LO+W,HI+W*2,W)):
#     fraction.loc[((fraction['sim_mag'] > low) &
#                    (fraction['sim_mag'] <= hi)), 'binc']= (low+hi)/2
fraction.head()
Out[27]:
| isRecovered | sim_mag | bins | |
|---|---|---|---|
| 0 | True | 21.451953 | (21.354, 21.59] |
| 1 | True | 22.592270 | (22.531, 22.766] |
| 2 | True | 21.624738 | (21.59, 21.825] |
| 3 | False | 22.330312 | (22.296, 22.531] |
| 4 | False | 20.427215 | (20.413, 20.649] |
In [28]:
result= fraction.groupby('bins').sum() / fraction.groupby('bins').count()
result.head(10)
Out[28]:
| isRecovered | sim_mag | |
|---|---|---|
| bins | ||
| (19.704, 19.943] | 1.000000 | 19.847891 |
| (19.943, 20.178] | 1.000000 | 20.087371 |
| (20.178, 20.413] | 1.000000 | 20.310795 |
| (20.413, 20.649] | 0.833333 | 20.526575 |
| (20.649, 20.884] | 0.875000 | 20.778800 |
| (20.884, 21.119] | 0.823529 | 21.037349 |
| (21.119, 21.354] | 0.965517 | 21.218799 |
| (21.354, 21.59] | 0.967742 | 21.465643 |
| (21.59, 21.825] | 0.775510 | 21.709568 |
| (21.825, 22.06] | 0.739130 | 21.930837 |
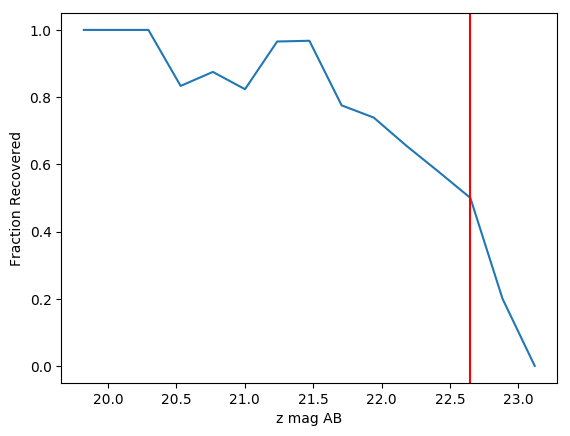
In [29]:
result.index[result['isRecovered'] <= 0.5][0]
Out[29]:
Interval(22.530999999999999, 22.765999999999998, closed='right')
Depth (fraction recovered versus mag)
In [30]:
plt.plot(result.index.categories.mid,result['isRecovered'])
plt.axvline(result.index.categories.mid[result['isRecovered'] <= 0.5][0],c='r',ls='-')
plt.xlabel('z mag AB')
plt.ylabel('Fraction Recovered')
Out[30]:
<matplotlib.text.Text at 0x7f02b8a60490>
In [31]:
frac_recovered= fraction.iloc[isim]
for objtype in objtypes:
    frac_recovered['is'+objtype]= cuts_obitractor[objtype][itrac]
frac_recovered.head()
/home/kaylan/env_galsim/lib/python2.7/site-packages/ipykernel_launcher.py:3: SettingWithCopyWarning:
A value is trying to be set on a copy of a slice from a DataFrame.
Try using .loc[row_indexer,col_indexer] = value instead

See the caveats in the documentation: http://pandas.pydata.org/pandas-docs/stable/indexing.html#indexing-view-versus-copy
  This is separate from the ipykernel package so we can avoid doing imports until
Out[31]:
| isRecovered | sim_mag | bins | ispsf | isrex | isexp | isdev | iscomp | |
|---|---|---|---|---|---|---|---|---|
| 0 | True | 21.451953 | (21.354, 21.59] | False | True | False | False | False |
| 1 | True | 22.592270 | (22.531, 22.766] | False | True | False | False | False |
| 2 | True | 21.624738 | (21.59, 21.825] | False | True | False | False | False |
| 5 | True | 21.212229 | (21.119, 21.354] | False | True | False | False | False |
| 6 | True | 21.583440 | (21.354, 21.59] | False | True | False | False | False |
In [32]:
result= frac_recovered.groupby('bins').sum() / frac_recovered.groupby('bins').count()
result.head()
Out[32]:
| isRecovered | sim_mag | ispsf | isrex | isexp | isdev | iscomp | |
|---|---|---|---|---|---|---|---|
| bins | |||||||
| (19.704, 19.943] | 1.0 | 19.847891 | 0.0 | 0.666667 | 0.333333 | 0.000000 | 0.0 |
| (19.943, 20.178] | 1.0 | 20.087371 | 0.0 | 0.000000 | 1.000000 | 0.000000 | 0.0 |
| (20.178, 20.413] | 1.0 | 20.310795 | 0.0 | 0.500000 | 0.500000 | 0.000000 | 0.0 |
| (20.413, 20.649] | 1.0 | 20.546447 | 0.0 | 0.400000 | 0.600000 | 0.000000 | 0.0 |
| (20.649, 20.884] | 1.0 | 20.773034 | 0.0 | 0.642857 | 0.285714 | 0.071429 | 0.0 |
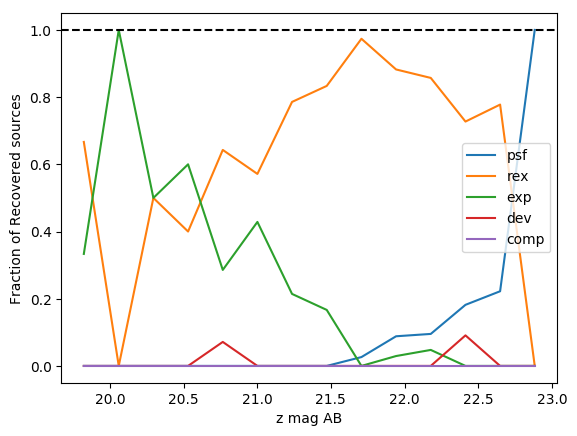
Depth 2 (fraction recovered by “type”)
In [33]:
for objtype,c in zip(objtypes,['y','m','b','g','cyan']):
    plt.plot(result.index.categories.mid,result['is'+objtype],label=objtype)
plt.axhline(1,c='k',ls='--')
plt.legend()
#plt.axvline(result.index[result['isRecovered'] <= 0.5][0],c='r',ls='-')
plt.xlabel('z mag AB')
plt.ylabel('Fraction of Recovered sources')
Out[33]:
<matplotlib.text.Text at 0x7f02bbb04f90>
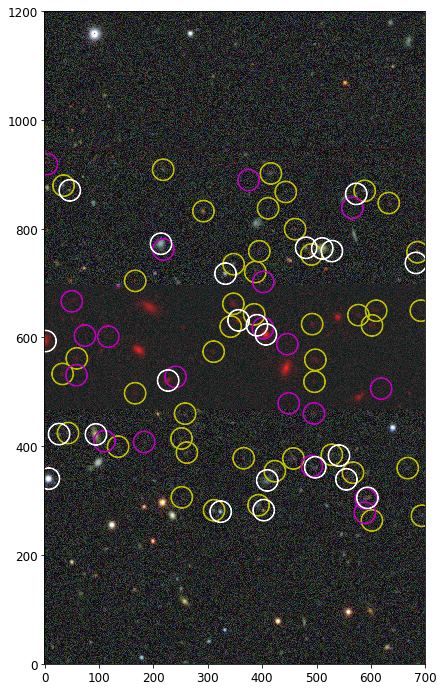
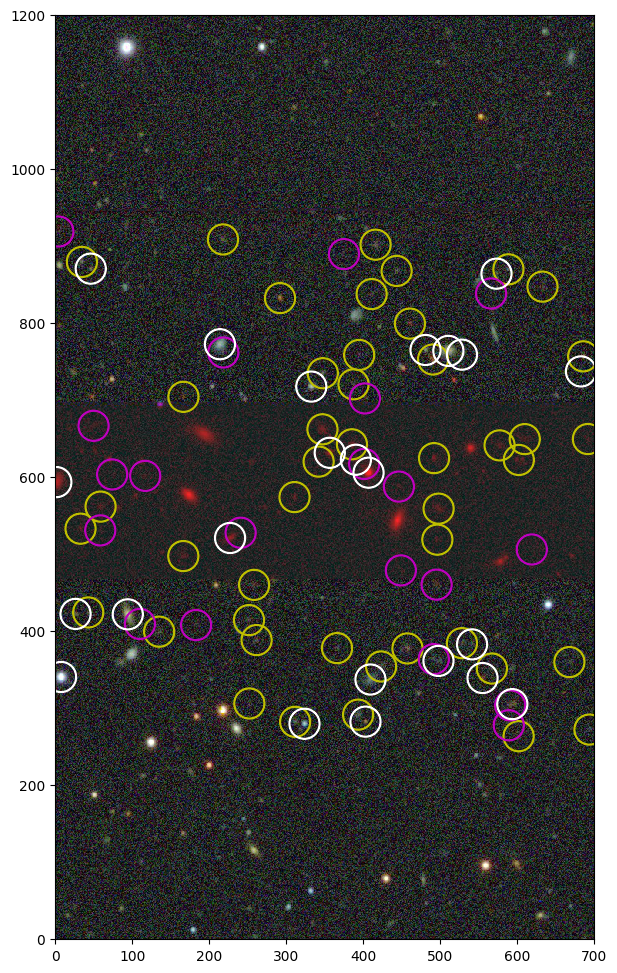
In [34]:
xslc,yslc= slice(2500,3200),slice(2300,3500)
fig,ax=plt.subplots(figsize=(8,12))

plotImage().imshow(sliceImage(img_jpg,xslc,yslc),ax)
# Recovered
plotImage().circles(obitractor.bx[itrac],obitractor.by[itrac],ax,
                    xslice=xslc,yslice=yslc,
                    color='y',r_pixels=5/0.262)
# Missed
plotImage().circles(simcat.x[not_isim],simcat.y[not_isim],ax,
                    xslice=xslc,yslice=yslc,
                    color='m',r_pixels=5/0.262)
# Real
plotImage().circles(obitractor.bx[not_itrac],obitractor.by[not_itrac],ax,
                    xslice=xslc,yslice=yslc,
                    color='w',r_pixels=5/0.262)
In [35]:
class Panel(object):
    """Plots panel of N cutouts for N sources from an image and any slice into it

    TODO: normalize each cutout before adding it to the panel

    Args:
        img: full image
        x_all,y_all: positions of all sources in the full image
        jpeg: bool, rotate fits image and jpeg image differently when display
        xslc,yslc: slice() objects if want to take subset of full image and sources
        hw: half-width [pixels]
        nrows: number of rows and also number of cols

    Returns:
        panel:
        panel
    """
    def __init__(self,img,x_all,y_all,
                 xslc=None,yslc=None,
                 nrows=2,hw=30):
        assert((len(x_all) > 0 ) & (len(y_all) > 0))
        dims = (nrows*hw*2,nrows*hw*2)
        if len(img.shape) == 3:
            dims = tuple(list(dims)+[3])
        self.panel= np.zeros(dims).astype(img.dtype)

        self.xpan= np.arange(0, dims[0], hw*2, dtype=int)
        self.ypan = np.arange(0, dims[1], hw*2, dtype=int)

        if xslc is None:
            xslc=slice(0,img.shape[0])
        if yslc is None:
            yslc=slice(0,img.shape[1])
        if len(dims) == 3:
            pil_img= Image.fromarray(sliceImage(img_jpg,xslc,yslc),mode='RGB')
        else:
            pil_img= Image.fromarray(sliceImage(img,xslc,yslc))
        keep= plotImage().justInSlice(x_all,y_all,xslc,yslc)
        x_inslice,y_inslice= x_all[keep],y_all[keep]
        print(len(x_inslice),nrows**2)
        npanels= min(nrows**2,len(x_inslice))
        i=0
        self.x,self.y=[],[]
        for xp,yp in itertools.product(self.xpan,self.ypan):
                xs,ys=x_inslice[i]-xslc.start,y_inslice[i]-yslc.start
                cutout= pil_img.crop((xs-hw,ys-hw,xs+hw,ys+hw))
                self.panel[xp:xp+2*hw, yp:yp+2*hw]= cutout
                # retain exact position
                self.x.append(xp+ hw + xs-int(xs))
                self.y.append(yp+ hw + ys-int(ys))
                i+=1
                if i >= npanels:
                    break
        self.x,self.y= np.array(self.x),np.array(self.y)

    def plot(self,ax,title=None):
        plotImage().imshow(self.panel,ax)
        plotImage().circles(self.x,self.y,ax,
                            img_shape=self.panel.shape,
                            color='y',r_pixels=5/0.262)
        # borders
        for xp,yp in zip(self.xpan[1:],self.ypan[1:]):
            ax.axvline(xp,c='y')
            ax.axhline(yp,c='y')
        if title:
            ax.set_title(title)
Visualize Real vs. Recovered sources
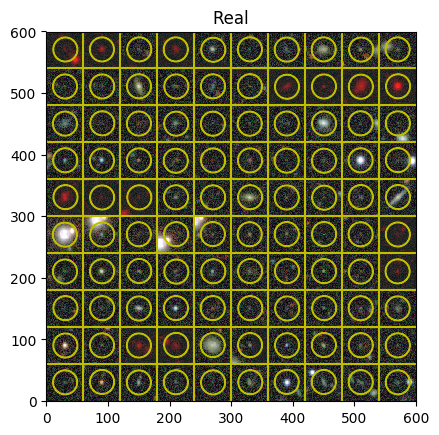
Real
In [39]:
xslc,yslc= None,None #slice(2500,3200),slice(2300,3500)
p= Panel(img_jpg,obitractor.bx[not_itrac],obitractor.by[not_itrac],
         xslc=xslc,yslc=yslc,
         hw=30,nrows=10)
fig,ax=plt.subplots()
p.plot(ax,title='Real')
(107, 100)
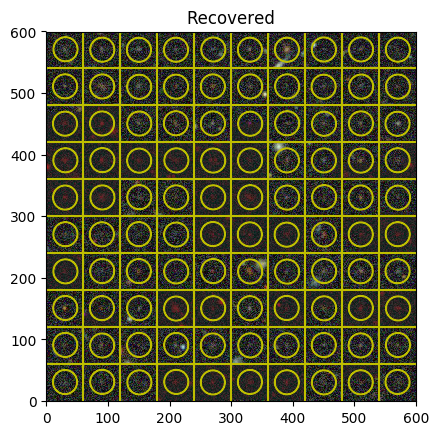
Recovered
In [40]:
xslc,yslc= None,None #slice(2500,3200),slice(2300,3500)
p= Panel(img_jpg,obitractor.bx[itrac],obitractor.by[itrac],
         xslc=xslc,yslc=yslc,
         hw=30,nrows=10)
fig,ax=plt.subplots()
p.plot(ax,title='Recovered')
(214, 100)
In [41]:
for col in obitractor.get_columns():
    if len(obitractor.get(col).shape) > 1:
        print('removing col=',col)
        obitractor.delete_column(col)
obitractor.get_columns()
('removing col=', 'dchisq')
('removing col=', 'apflux_u')
('removing col=', 'apflux_g')
('removing col=', 'apflux_r')
('removing col=', 'apflux_i')
('removing col=', 'apflux_z')
('removing col=', 'apflux_y')
('removing col=', 'apflux_resid_u')
('removing col=', 'apflux_resid_g')
('removing col=', 'apflux_resid_r')
('removing col=', 'apflux_resid_i')
('removing col=', 'apflux_resid_z')
('removing col=', 'apflux_resid_y')
('removing col=', 'apflux_ivar_u')
('removing col=', 'apflux_ivar_g')
('removing col=', 'apflux_ivar_r')
('removing col=', 'apflux_ivar_i')
('removing col=', 'apflux_ivar_z')
('removing col=', 'apflux_ivar_y')
Out[41]:
['release',
 'brickid',
 'brickname',
 'objid',
 'brick_primary',
 'type',
 'ra',
 'dec',
 'ra_ivar',
 'dec_ivar',
 'bx',
 'by',
 'ebv',
 'mjd_min',
 'mjd_max',
 'flux_u',
 'flux_g',
 'flux_r',
 'flux_i',
 'flux_z',
 'flux_y',
 'flux_ivar_u',
 'flux_ivar_g',
 'flux_ivar_r',
 'flux_ivar_i',
 'flux_ivar_z',
 'flux_ivar_y',
 'mw_transmission_u',
 'mw_transmission_g',
 'mw_transmission_r',
 'mw_transmission_i',
 'mw_transmission_z',
 'mw_transmission_y',
 'nobs_u',
 'nobs_g',
 'nobs_r',
 'nobs_i',
 'nobs_z',
 'nobs_y',
 'rchisq_u',
 'rchisq_g',
 'rchisq_r',
 'rchisq_i',
 'rchisq_z',
 'rchisq_y',
 'fracflux_u',
 'fracflux_g',
 'fracflux_r',
 'fracflux_i',
 'fracflux_z',
 'fracflux_y',
 'fracmasked_u',
 'fracmasked_g',
 'fracmasked_r',
 'fracmasked_i',
 'fracmasked_z',
 'fracmasked_y',
 'fracin_u',
 'fracin_g',
 'fracin_r',
 'fracin_i',
 'fracin_z',
 'fracin_y',
 'anymask_u',
 'anymask_g',
 'anymask_r',
 'anymask_i',
 'anymask_z',
 'anymask_y',
 'allmask_u',
 'allmask_g',
 'allmask_r',
 'allmask_i',
 'allmask_z',
 'allmask_y',
 'psfsize_u',
 'psfsize_g',
 'psfsize_r',
 'psfsize_i',
 'psfsize_z',
 'psfsize_y',
 'psfdepth_u',
 'psfdepth_g',
 'psfdepth_r',
 'psfdepth_i',
 'psfdepth_z',
 'psfdepth_y',
 'galdepth_u',
 'galdepth_g',
 'galdepth_r',
 'galdepth_i',
 'galdepth_z',
 'galdepth_y',
 'fracdev',
 'fracdev_ivar',
 'shapeexp_r',
 'shapeexp_r_ivar',
 'shapeexp_e1',
 'shapeexp_e1_ivar',
 'shapeexp_e2',
 'shapeexp_e2_ivar',
 'shapedev_r',
 'shapedev_r_ivar',
 'shapedev_e1',
 'shapedev_e1_ivar',
 'shapedev_e2',
 'shapedev_e2_ivar']
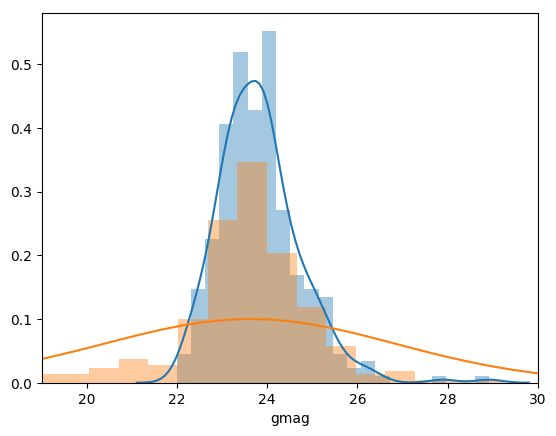
In [42]:
simcat_df= fits2pandas(simcat)
simcat_df['gmag']= F.simcat(simcat_df['gflux'])
sns.distplot(simcat_df['gmag'])

obitractor_df= fits2pandas(obitractor)
obitractor_df['gmag']= F.tractor(obitractor_df['flux_g'],
                                 obitractor_df['mw_transmission_z'])
sns.distplot(obitractor_df['gmag'])

plt.xlim(19,30)
#gmag= F.tractor(obitractor.flux_z[isObj],
#                obitractor.mw_transmission_z[isObj])
Out[42]:
(19, 30)
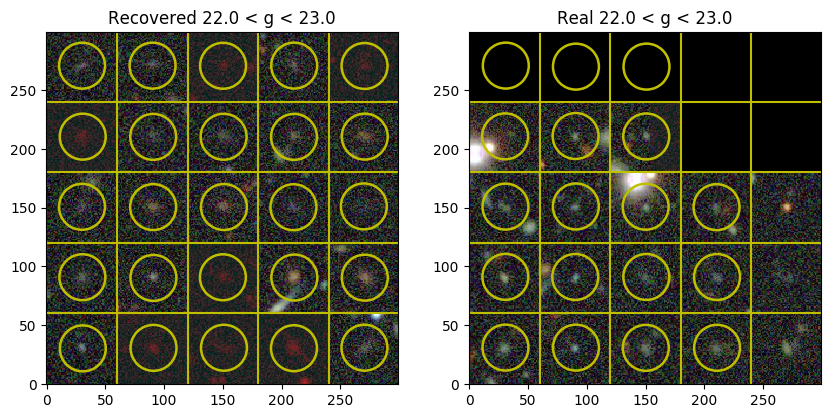
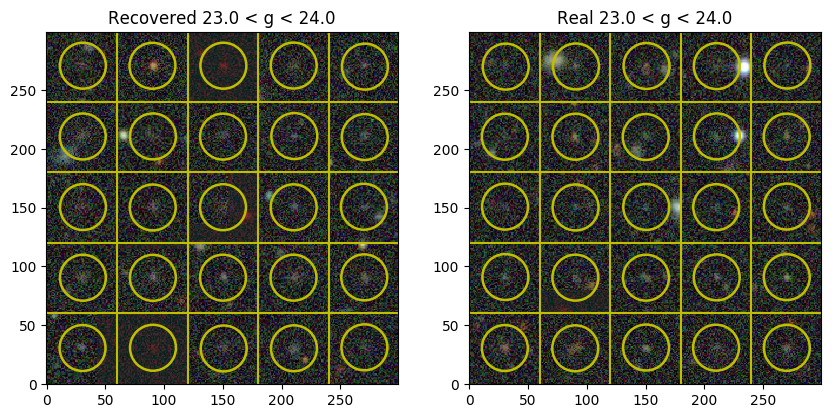
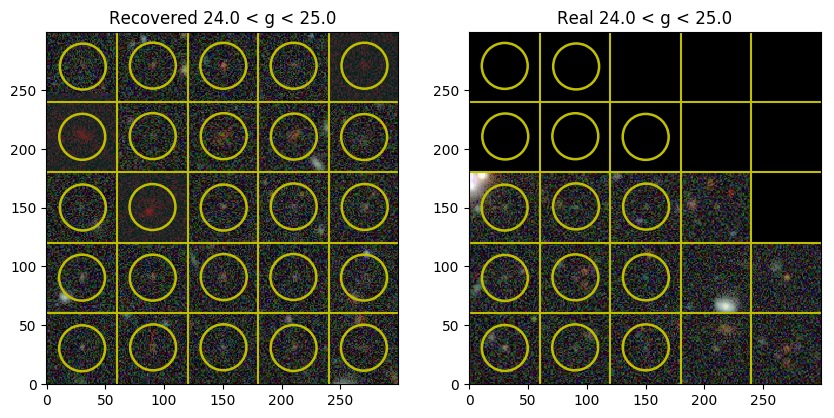
Real vs. Recovered grouped by g-mag
In [ ]:
gmag_bins= np.linspace(22,26,num=5)
simcat_df['gmag_bins']= pd.cut(simcat_df['gmag'],bins=gmag_bins)
obitractor_df['gmag_bins']= pd.cut(obitractor_df['gmag'],bins=gmag_bins)
In [44]:
simcat_df.sort_values('gmag')['gmag'].head()
Out[44]:
224    21.993821
32     22.268190
182    22.290115
222    22.303895
90     22.318836
Name: gmag, dtype: float64
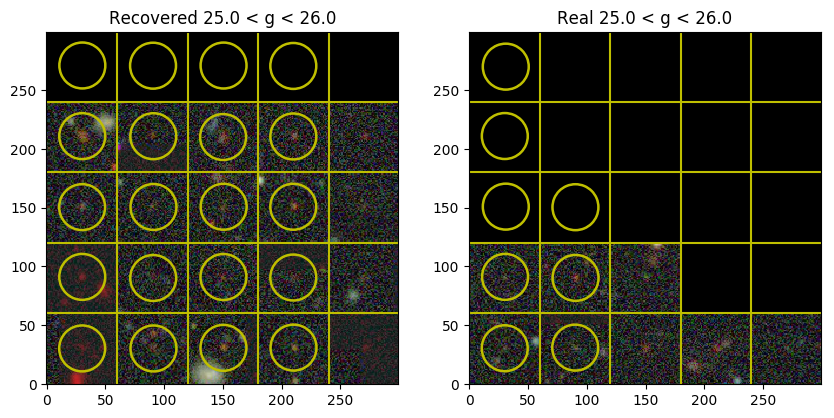
In [3]:
print('Each 30 image mosaic has faintest (top left) and brightest (bottom right)')
Each 30 image mosaic has faintest (top left) and brightest (bottom right)
In [45]:
simcat_df_rec= simcat_df.iloc[isim].sort_values('gmag')
obitractor_df_real= obitractor_df.iloc[not_itrac].sort_values('gmag')
for categ in simcat_df['gmag_bins'].cat.categories:
    keep= simcat_df_rec['gmag_bins'] == categ
    if len(simcat_df_rec[keep]) > 0:
        simPanel= Panel(img_jpg,
                        simcat_df_rec.loc[keep,'x'].values,
                        simcat_df_rec.loc[keep,'y'].values,
                        hw=30,nrows=5)
    keep= obitractor_df_real['gmag_bins'] == categ
    if len(obitractor_df_real[keep]) > 0:
        obiPanel= Panel(img_jpg,
                        obitractor_df_real.loc[keep,'bx'].values,
                        obitractor_df_real.loc[keep,'by'].values,
                        hw=30,nrows=5)

    fig,ax=plt.subplots(1,2,figsize=(10,5))
    text= '%.1f < g < %.1f' % (categ.left,categ.right)
    simPanel.plot(ax[0],title='Recovered '+text)
    obiPanel.plot(ax[1],title='Real '+text)
(43, 25)
(18, 25)
(102, 25)
(25, 25)
(42, 25)
(14, 25)
(20, 25)
(8, 25)
In [46]:
def myshuffle(n):
    indices= np.arange(n)
    np.random.shuffle(indices)
    return indices

myshuffle(10)
Out[46]:
array([8, 5, 0, 2, 1, 9, 7, 3, 6, 4])
Properties of Recovered sources
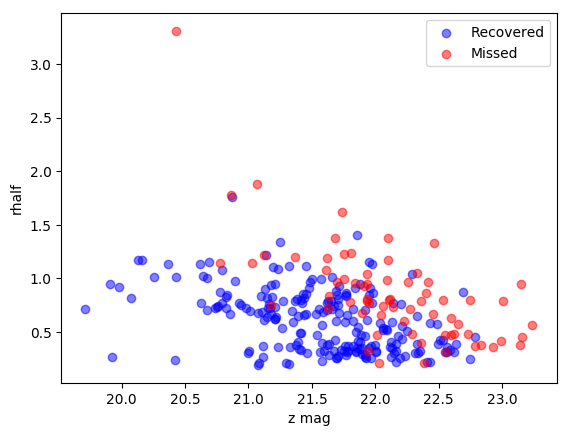
Recovered != func( rhalf )
In [47]:
# Recovered vs. Missed
mag= F.simcat(simcat.zflux)
plt.scatter(mag[isim],simcat.rhalf[isim],c='b',label='Recovered',alpha=0.5)
plt.scatter(mag[not_isim],simcat.rhalf[not_isim],c='r',label='Missed',alpha=0.5)
plt.xlabel('z mag')
plt.ylabel('rhalf')
plt.legend()
Out[47]:
<matplotlib.legend.Legend at 0x7f02bd7ba790>
In [48]:
print(set(obitractor_df['type']))
obitractor.get_columns()
set(['PSF ', 'EXP ', 'DEV ', 'COMP', 'REX '])
Out[48]:
['release',
 'brickid',
 'brickname',
 'objid',
 'brick_primary',
 'type',
 'ra',
 'dec',
 'ra_ivar',
 'dec_ivar',
 'bx',
 'by',
 'ebv',
 'mjd_min',
 'mjd_max',
 'flux_u',
 'flux_g',
 'flux_r',
 'flux_i',
 'flux_z',
 'flux_y',
 'flux_ivar_u',
 'flux_ivar_g',
 'flux_ivar_r',
 'flux_ivar_i',
 'flux_ivar_z',
 'flux_ivar_y',
 'mw_transmission_u',
 'mw_transmission_g',
 'mw_transmission_r',
 'mw_transmission_i',
 'mw_transmission_z',
 'mw_transmission_y',
 'nobs_u',
 'nobs_g',
 'nobs_r',
 'nobs_i',
 'nobs_z',
 'nobs_y',
 'rchisq_u',
 'rchisq_g',
 'rchisq_r',
 'rchisq_i',
 'rchisq_z',
 'rchisq_y',
 'fracflux_u',
 'fracflux_g',
 'fracflux_r',
 'fracflux_i',
 'fracflux_z',
 'fracflux_y',
 'fracmasked_u',
 'fracmasked_g',
 'fracmasked_r',
 'fracmasked_i',
 'fracmasked_z',
 'fracmasked_y',
 'fracin_u',
 'fracin_g',
 'fracin_r',
 'fracin_i',
 'fracin_z',
 'fracin_y',
 'anymask_u',
 'anymask_g',
 'anymask_r',
 'anymask_i',
 'anymask_z',
 'anymask_y',
 'allmask_u',
 'allmask_g',
 'allmask_r',
 'allmask_i',
 'allmask_z',
 'allmask_y',
 'psfsize_u',
 'psfsize_g',
 'psfsize_r',
 'psfsize_i',
 'psfsize_z',
 'psfsize_y',
 'psfdepth_u',
 'psfdepth_g',
 'psfdepth_r',
 'psfdepth_i',
 'psfdepth_z',
 'psfdepth_y',
 'galdepth_u',
 'galdepth_g',
 'galdepth_r',
 'galdepth_i',
 'galdepth_z',
 'galdepth_y',
 'fracdev',
 'fracdev_ivar',
 'shapeexp_r',
 'shapeexp_r_ivar',
 'shapeexp_e1',
 'shapeexp_e1_ivar',
 'shapeexp_e2',
 'shapeexp_e2_ivar',
 'shapedev_r',
 'shapedev_r_ivar',
 'shapedev_e1',
 'shapedev_e1_ivar',
 'shapedev_e2',
 'shapedev_e2_ivar']
In [51]:
isGal= obitractor_df['type'] == 'PSF '
obitractor_df.loc[isGal,['type','psfsize_g','psfsize_r','psfsize_z','shapeexp_r','shapedev_r']].head()
Out[51]:
| type | psfsize_g | psfsize_r | psfsize_z | shapeexp_r | shapedev_r | |
|---|---|---|---|---|---|---|
| 8 | PSF | 1.217095 | 1.041571 | 1.166601 | 0.0 | 0.0 |
| 15 | PSF | 1.217095 | 1.041571 | 1.063296 | 0.0 | 0.0 |
| 18 | PSF | 1.217095 | 1.041571 | 1.091158 | 0.0 | 0.0 |
| 24 | PSF | 1.217095 | 1.041571 | 1.105378 | 0.0 | 0.0 |
| 28 | PSF | 1.217095 | 1.041571 | 1.168029 | 0.0 | 0.0 |
In [52]:
# Recovered vs. Real
isGal= obitractor_df['type'] != 'PSF '
obitractor_df.loc[isGal,['type','psfsize_g','psfsize_r','psfsize_z','shapeexp_r','shapedev_r']].head()
Out[52]:
| type | psfsize_g | psfsize_r | psfsize_z | shapeexp_r | shapedev_r | |
|---|---|---|---|---|---|---|
| 0 | REX | 1.238828 | 1.038830 | 1.152590 | 0.926860 | 0.0 |
| 1 | REX | 1.217095 | 1.041571 | 1.244965 | 0.261353 | 0.0 |
| 2 | REX | 1.217095 | 1.041571 | 1.155406 | 0.701151 | 0.0 |
| 3 | REX | 1.217095 | 1.041571 | 1.154364 | 0.529196 | 0.0 |
| 4 | REX | 1.217095 | 1.041571 | 1.156058 | 0.642927 | 0.0 |
In [53]:
obitractor_df.loc[:,['shapeexp_r','shapedev_r']].shape #max(axis=1).shape
Out[53]:
(321, 2)
In [54]:
len(simcat[isim]),len(obitractor[itrac]),len(simcat_df.iloc[isim]),len(obitractor_df.iloc[isim])
Out[54]:
(214, 214, 214, 214)
In [64]:
np.max([obitractor.shapeexp_r,obitractor.shapeexp_r],axis=0).shape
Out[64]:
(321,)
In [66]:
def get_source_sizes(tractor):
    rhalf= np.zeros(len(tractor))-1
    isGal= np.char.strip(tractor.get('type')) != 'PSF'
    vals= [tractor[isGal].get(col).max()
           for col in ['shapeexp_r','shapedev_r']]
    rhalf[isGal]= np.max([obitractor[isGal].shapeexp_r,
                          obitractor[isGal].shapedev_r],axis=0)
    rhalf[~isGal]= np.max([obitractor[~isGal].psfsize_g,
                           obitractor[~isGal].psfsize_r,
                           obitractor[~isGal].psfsize_z],axis=0)
    return rhalf

obitractor.set('rhalf',get_source_sizes(obitractor))
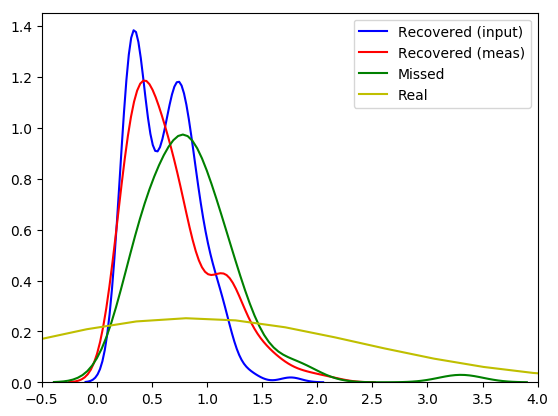
In [70]:
sns.distplot(simcat[isim].rhalf,hist=False,
             color='b',label='Recovered (input)')
sns.distplot(obitractor[itrac].rhalf,hist=False,
             color='r',label='Recovered (meas)')
sns.distplot(simcat[not_isim].rhalf,hist=False,
             color='g',label='Missed')
sns.distplot(obitractor[not_itrac].rhalf,hist=False,
             color='y',label='Real')
#print(simcat_df.iloc[isim]['rhalf'].min())
#print(obitractor_df.iloc[itrac]['rhalf'].min())
plt.xlim(-0.5,4)
plt.legend()
Out[70]:
<matplotlib.legend.Legend at 0x7f02b81815d0>
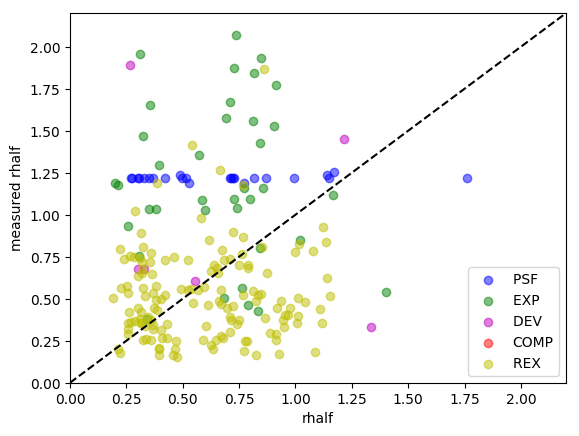
Huge scatter in True/Measured rhalf
In [134]:
sim_rec= simcat[isim]
obi_rec= obitractor[isim]
for typ,c in zip(set(obi_rec.get('type')),
                 ['b','g','m','r','y']):
    keep= obi_rec.get('type') == typ
    plt.scatter(sim_rec[keep].rhalf,
                obi_rec[keep].rhalf,
                c=c,label=typ,alpha=0.5)
lim=(0,2.2)
plt.xlim(lim)
plt.ylim(lim)
plt.plot(lim,lim,'k--')
plt.xlabel('rhalf')
plt.ylabel('measured rhalf')
plt.legend()
Out[134]:
<matplotlib.legend.Legend at 0x7f02b71b7bd0>
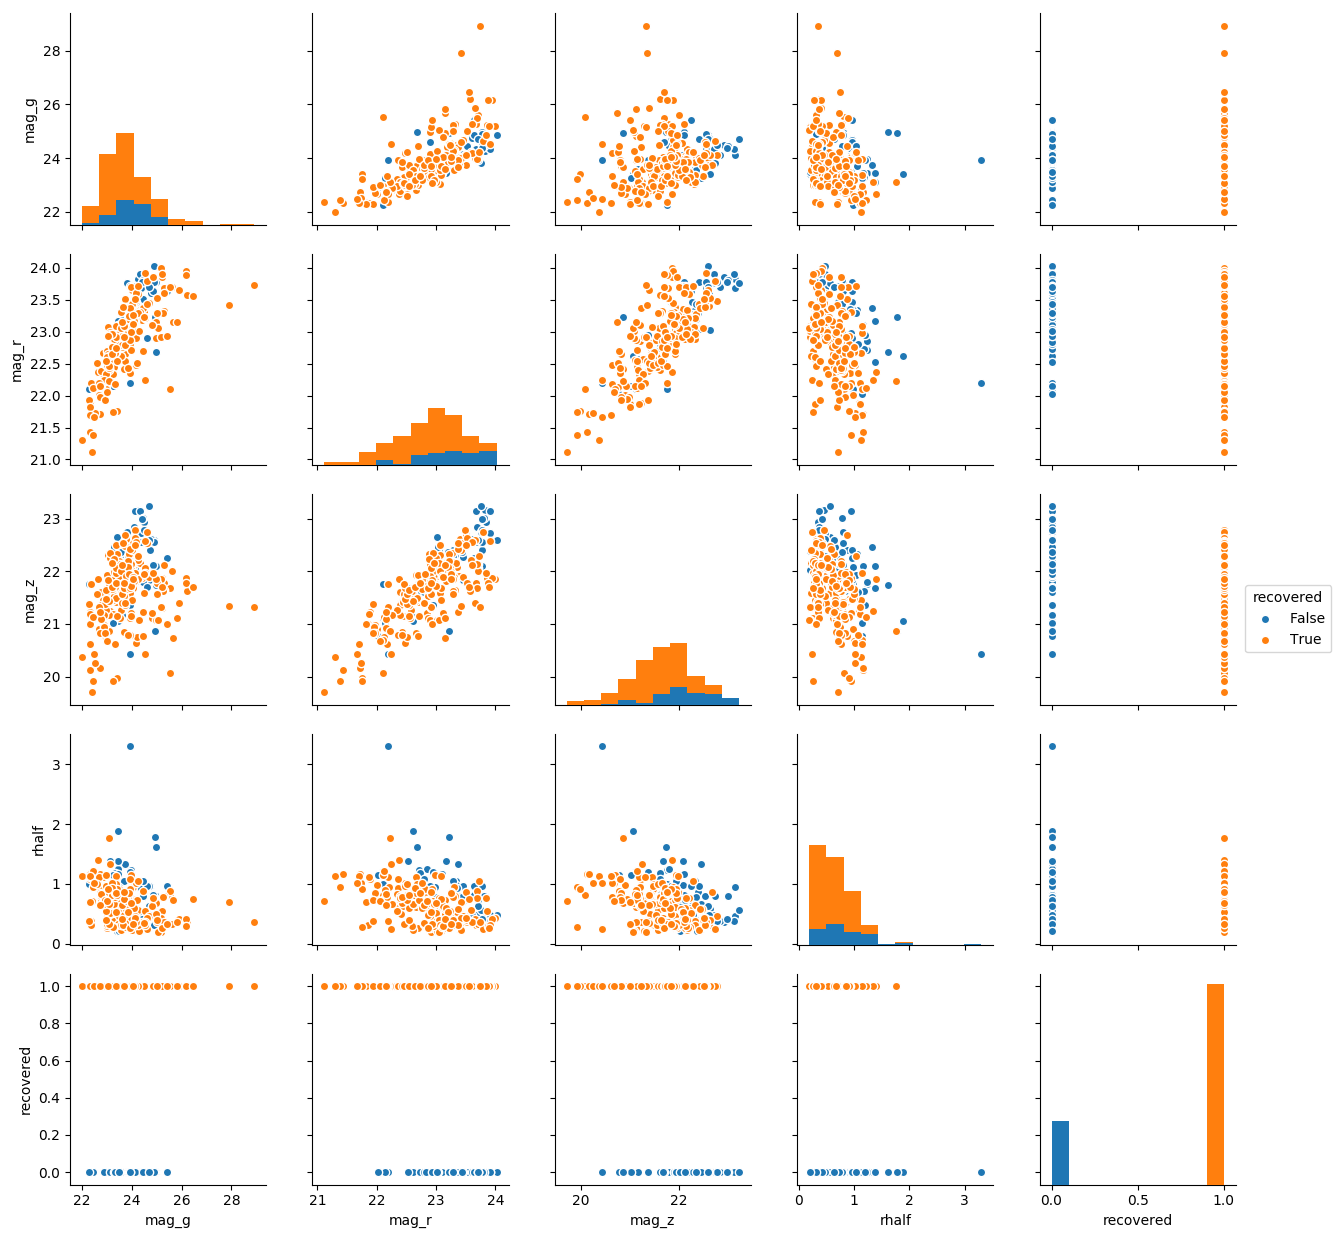
Pairplot (hue= Recoverec)
In [135]:
simcat_df= fits2pandas(simcat)
for b in ['g','r','z']:
    simcat_df['mag_'+b]= F.simcat(simcat.get(b+'flux')).data

attrs= ['mag_g','mag_r','mag_z','rhalf','recovered']
simcat_df['recovered']= indices2bool(isim,len(simcat_df))
g = sns.pairplot(simcat_df[attrs], hue="recovered")
By not adding DEV galaxies, I put into too many EXP
In [137]:
n_rec= len(obitractor_df.iloc[itrac])
n_real= len(obitractor_df.iloc[not_itrac])

rex_to_exp=True
if rex_to_exp:
    obitractor_df['type'][obitractor_df['type'] == 'REX '] = 'EXP '
df=obitractor_df['type'].iloc[itrac].value_counts().to_frame() / n_rec
df.rename(columns={'type':'recovered'},inplace=True)
df= pd.merge(df,obitractor_df['type'].iloc[not_itrac].value_counts().to_frame(),
             left_index=True,right_index=True)
df= df.rename(columns={'type':'real'})
df['real']= df['real']/n_real
display(df.head())
df.plot.barh()
/home/kaylan/env_galsim/lib/python2.7/site-packages/ipykernel_launcher.py:6: SettingWithCopyWarning:
A value is trying to be set on a copy of a slice from a DataFrame

See the caveats in the documentation: http://pandas.pydata.org/pandas-docs/stable/indexing.html#indexing-view-versus-copy
| recovered | real | |
|---|---|---|
| EXP | 0.939252 | 0.654206 |
| PSF | 0.051402 | 0.233645 |
| DEV | 0.009346 | 0.093458 |
Out[137]:
<matplotlib.axes._subplots.AxesSubplot at 0x7f02b5ec6750>

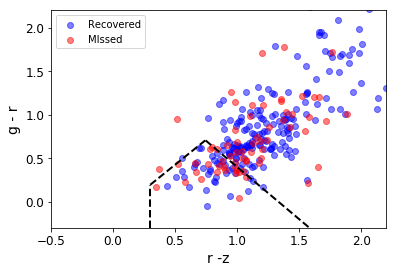
Reocvered vs. Missed
In [99]:
from obiwan.priors import TSBox
TS box
In [100]:
# g-r vs. r-z
ts= TSBox(src='ELG')

fig,ax=plt.subplots()
ts.add_ts_box(ax, xlim=[-0.5,2.2],ylim=[-0.3,2.2])
rz= simcat_df['mag_r'] - simcat_df['mag_z']
gr= simcat_df['mag_g'] - simcat_df['mag_r']
ax.scatter(rz[isim],gr[isim],c='b',label='Recovered',alpha=0.5)
ax.scatter(rz[not_isim],gr[not_isim],c='r',label='MIssed',alpha=0.5)
ax.set_xlabel('r -z')
ax.set_ylabel('g - r')
ax.legend()
ax.set_xlim([-0.5,2.2])
ax.set_ylim([-0.3,2.2])
Out[100]:
(-0.3, 2.2)
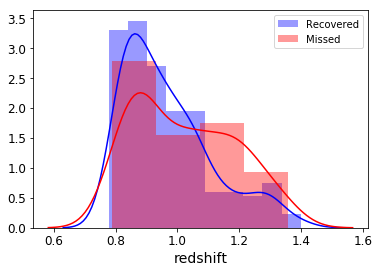
Redshift
In [101]:
sns.distplot(simcat_z['redshift'][isim],color='b',label='Recovered')
sns.distplot(simcat_z['redshift'][not_isim],color='r',label='Missed')
plt.legend()
Out[101]:
<matplotlib.legend.Legend at 0x7f67cf36d850>
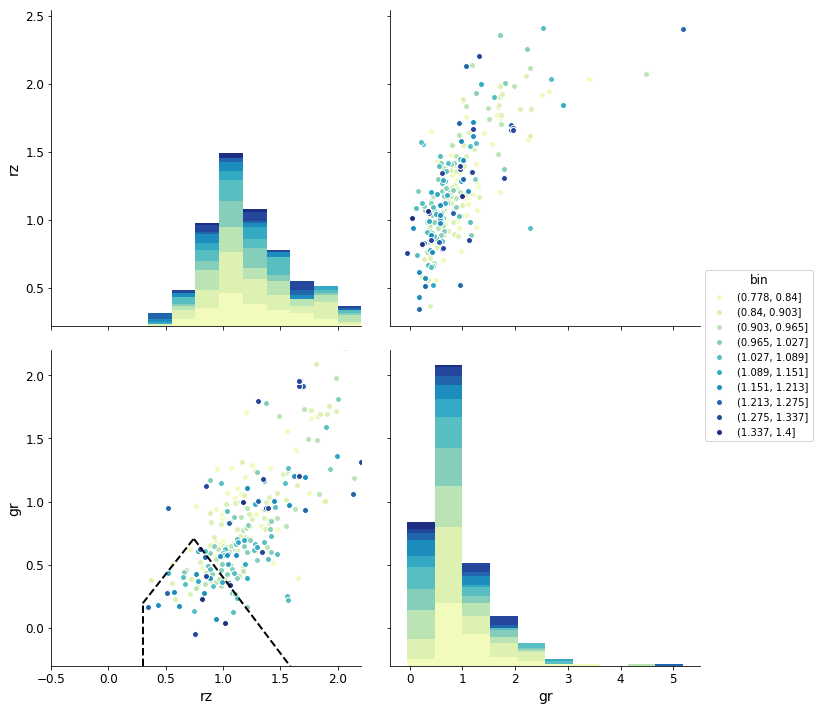
TS box colorcoded by Redshift
In [102]:
simcat_z['rz']= simcat_z['mag_r'] - simcat_z['mag_z']
simcat_z['gr']= simcat_z['mag_g'] - simcat_z['mag_r']
#zmin,zmax=
simcat_z["bin"] = pd.cut(simcat_z['redshift'],bins=10)

attrs= ['rz','gr','bin']
g = sns.pairplot(simcat_z[attrs], hue="bin",
                 hue_order=simcat_z.bin.cat.categories,
                 palette="YlGnBu",size=5)

ts= TSBox(src='ELG')
ts.add_ts_box(g.axes[1,0], xlim=[-0.5,2.2],ylim=[-0.3,2.2])
g.axes[1,0].set_xlim(-0.5,2.2)
g.axes[1,0].set_ylim(-0.3,2.2)
Out[102]:
(-0.3, 2.2)